Lp-PLA2, also known as platelet-activating factor acetylhydrolase (PAF-AH), was initially identified as the enzyme responsible for hydrolyzing and inactivating the inflammatory phospholipid PAF (1-O-alkyl-2-acetyl-sn-glycero-3-phosphocholine).1-3
PAF is a biologically active phospholipid that expresses several inflammatory activities and is involved in various pathophysiological conditions including atherogenesis.1-3 PAF is hydrolyzed and inactivated by PAF-acetylhydrolase, a Ca2+-independent, phospholipase A2 (PLA2).3 PAF-acetylhydrolase circulates in plasma in active form bound to lipoproteins,4-6 and is thus known as lipoprotein-associated phospholipase A2 (Lp-PLA2).6
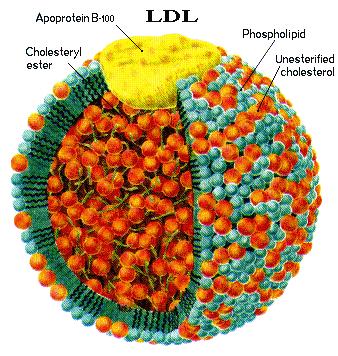
Approximately 80% of Lp-PLA2 circulates bound to low-density lipoprotein (LDL), whereas the other 20% is bound to high-density lipoprotein (HDL).7,8 Lp-PLA2 hydrolyzes the sn-2 ester bond in phospholipids of which the fatty acid moiety has been shortened or altered by oxidation to yield oxidized fatty acid and lysophosphatidylcholine (lysoPC).9 These metabolites have inflammatory properties,10 and lysoPC has been shown to have adverse effects on endothelial function.11-13
Lp-PLA2 could, therefore, play a direct role in the development of endothelial dysfunction and coronary artery disease (CAD). In addition, it may also serve as a useful biomarker for predicting coronary endothelial dysfunction.14
More recent evidence demonstrates that in addition to the lipoproteins, another carrier of Lp-PLA2 in human plasma is platelet-borne microparticles (PMPs).15,16 It is well-documented that Lp-PLA2 is a cardiovascular disease (CVD)-specific vascular inflammation biomarker which has been shown to be strongly predictive of CVD events, including stroke.
The precise pathophysiological role of the Lp-PLA2 enzyme in plasma as well as in the artery wall needs further clarification.
Several studies have suggested that the exact role of Lp-PLA2 may be differentiated according to the type of the lipoprotein carrier with which Lp-PLA2 circulates in plasma. Lp-PLA2 also plays a inflammatory role in coronary endothelial dysfunction and early atherosclerosis.14
Several population-based studies have shown that elevated lipoprotein-associated phospholipase A2 (Lp-PLA2) levels are associated with an increased risk of coronary heart disease and ischemic stroke.14,17-31
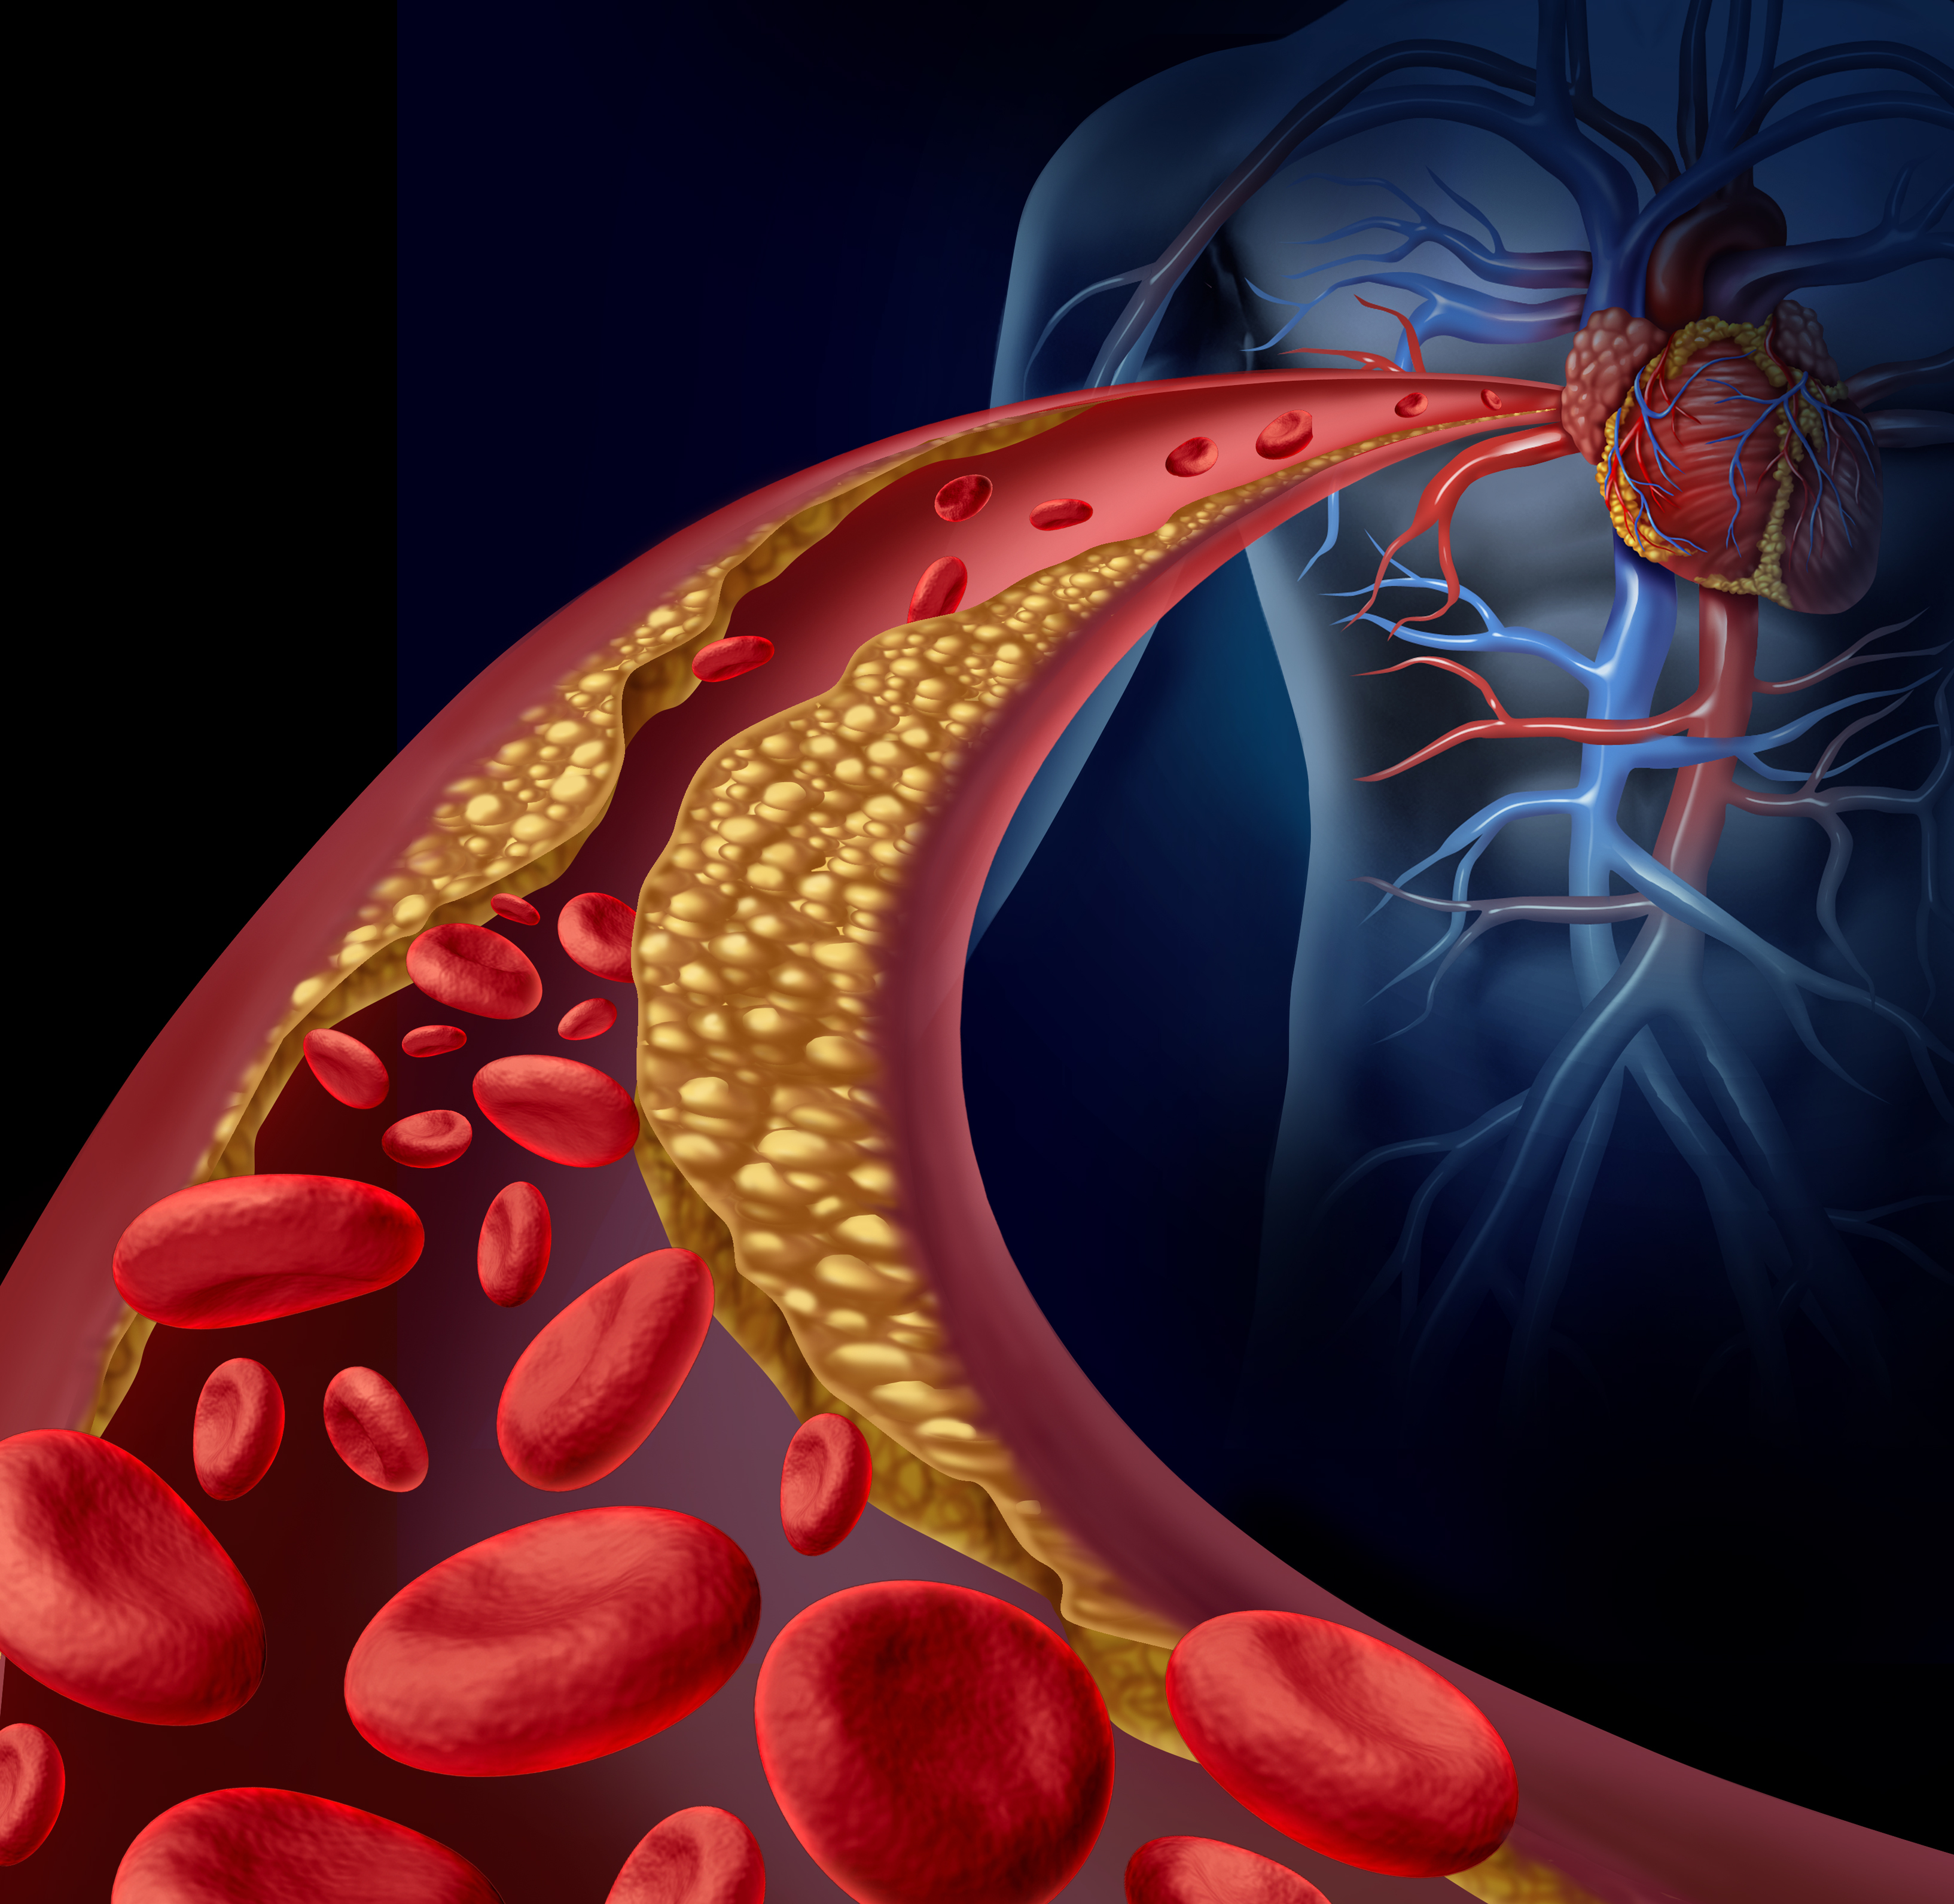
Rupture Prone Plaque & Lp-PLA2
Lp-PLA2 is a marker of vascular-specific inflammation and reflects the presence of rupture-prone plaque. Elevated levels of serum Lp-PLA2 are indicative of rupture-prone plaque and a strong independent predictor of cardiovascular risk, including CAD, myocardial infarction (MI), and stroke.18
Lp-PLA2 is clinically associated with an increased CHD risk, and there is a large body of published evidence from epidemiologic studies addressing the relationship of Lp-PLA2 and risk of cardiovascular disease.32-34
Although a small proportion of circulating Lp-PLA2 activity is associated with high-density lipoprotein (HDL), the majority (~80%) is associated with LDL. In particular, Lp-PLA2 is a potential marker for atherogenic small dense LDL (sdLDL), as most LDL-associated Lp-PLA2 (LDL–Lp-PLA2) is found complexed with sdLDL particles.16
The distribution of Lp-PLA2 between LDL and HDL is altered in various types of dyslipidemias (e.g., when plasma levels of lipoprotein (a) [Lp(a)] exceed 30 mg/dL)7,35; moreover, evidence suggests that the role of Lp-PLA2 in atherosclerosis may depend upon the type of lipoprotein particle with which it is associated.
For example, while several population-based studies have demonstrated independent association of plasma Lp-PLA2 levels—which largely reflect LDL–Lp-PLA2—with increased cardiovascular risk, HDL-associated Lp-PLA2 may be atheroprotective.7 Recent studies also indicate that oxidized phospholipids (oxPL) are preferentially sequestered by Lp(a), and subsequently degraded by Lp(a)-associated Lp-PLA2. These findings suggest that Lp(a) is a potential scavenger of oxPL, providing novel insight into the role of Lp(a) and Lp(a)-associated Lp-PLA2 in normal physiology as well as in inflammation and atherosclerosis.16
Elevated plasma Lp-PLA2 raises the risk of cardiovascular events by approximately 2 fold.16 Multiple prospective epidemiologic studies have demonstrated association of increased Lp-PLA2 levels with primary coronary or cardiovascular events, future coronary events, and stroke, suggesting that Lp-PLA2 has significant clinical utility as a cardiovascular risk marker.17
Further support for the proatherogenic role of LDL–Lp-PLA2 is derived from its preferential association with sdLDL,36 the most atherogenic LDL species.37 The enrichment of sdLDL with Lp- PLA2 enhances production of lysoPC during oxidation, in both normolipidemic and hypercholesterolemic patients.38 Other studies have demonstrated that Lp-PLA2 may significantly contribute to the atherogenicity of the electronegative LDL subfraction.39,40
Lp-PLA2 and Ethnicity
Emerging data suggest that metabolic and inflammatory factors impacting CVD risk differ across ethnic groups.26,32,33 There are several important differences between African-Americans and Caucasians with respect to Lp-PLA2. First, among subjects with CAD, Lp-PLA2 activity levels were higher among African- Americans. Second, the difference in Lp-PLA2 activity levels between CAD and non-CAD subjects was higher among African- Americans. Furthermore, the Lp-PLA2 index, a measure of enzymatic properties, was independently associated with the extent of CAD among African-Americans.41
Lp-PLA2 and Cardiovascular Disease
Functional medicine physicians seek the underlying problem. Cardiovascular disease is a complex process with over 400 different contributing risk factors. Understanding Lp-PLA2 helps us evaluate cardiovascular disease risk as well as where we should place our efforts to try to resolve the issue.
Lp-PLA2 is a vascular-specific proinflammatory enzyme that operates in the arterial intima.
Lp-PLA2 localizes to atherosclerotic plaque, particularly in those with a necrotic core and in ruptured plaques.42High levels of Lp-PLA2 are found in rupture- prone plaques, and it appears that Lp-PLA2 is released from these plaques into the circulation. Lp-PLA2 is primarily produced by macrophages and then bound to various lipoproteins, including the apoB portion of LDLs and Lp(a).14
Staining of coronary and carotid tissue demonstrates the presence of Lp-PLA2 in the thin fibrous cap of rupture-prone plaques, but not in the early-stage plaques.43 Coronary and carotid tissue concentrations of Lp- PLA2 are notably very high in the rupture-prone shoulder region of thin fibrous cap atheromas, and histopathologic stains reveal that Lp-PLA2 colocalizes with macrophages and oxidized LDL in atherosclerotic coronary and carotid plaques.44
Lp-PLA2 hydrolyzes phospholipids on oxidized LDL particles in the subendothelial space. Lp-PLA2 hydrolyzes the center (n-2) ester bond of phospholipids, which yields oxidized fatty acids and lysoPC, a molecule with a range of potentially atherogenic effects, including chemoattraction of monocytes, increased expression of adhesion molecules, and inhibition of endothelial nitric oxide production.10,45
In this manner, a vicious cycle is set up that leads to the recruitment of monocytes to the intima, where they differentiate to become macrophages and, ultimately, foam cells, while at the same time locally producing more Lp-PLA2.
Furthermore, lysoPC has been found to be cytotoxic to vascular smooth muscle cells and can induce the local production of matrix metalloproteinases (MMPs), which can thin the fibrous cap and destabilize the architectural integrity of an atheromatous plaque, increasing its propensity to rupture.46
In terms of its utility as a circulating biomarker, Lp-PLA2 produced by activated macrophages and foam cells re- enters the bloodstream and can be measured. As reported by Lavi et al., Lp-PLA2 blood concentrations sampled simultaneously in the human coronary sinus demonstrated a net increase in Lp-PLA2 levels as blood traverses the coronary vascular bed with significant atherosclerotic plaque.14 However, when no coronary plaque is present, a decrease in Lp-PLA2 levels is found. This study also showed that the lysoPC produced by the Lp-PLA2-mediated hydrolysis of oxidized LDL is strongly associated with coronary artery endothelial dysfunction.
Summary of Lp-PLA2 Clinical Studies:
Lp-PLA2 is a Predictor of Cardiovascular and Stroke Events:
An independent risk factor for CVD and stroke events14,18
2x risk for CVD events when elevated
5.5x risk for stroke events when elevated
Predicts CVD in elderly men and women even with normal LDL-C levels19
Additive risk with CRP18,20 or systolic blood pressure (SBP)20
When both Lp-PLA2 and CRP are very high—4x risk for CVD events
When both Lp-PLA2 and SBP are very high—6.4x risk for ischemic stroke
When both Lp-PLA2 and CRP are very high—11.4x risk for ischemic stroke
Lp-PLA2 with CRP predicts recurrence and severity of second stroke event24
Additive risk from Lp-PLA2 and CRP beyond carotid IMT results25
Predicts angiographic finding of coronary atherosclerosis14,22
Predicts coronary death22
Predicts coronary endothelial dysfunction, which is a marker for early atherosclerosis and increased risk of ischemic cardiac events and stroke14
Lp-PLA2 is primarily associated with LDL (LDL-Lp-PLA2); a small amount of the enzyme activity is also associated with HDL.16
Most LDL-Lp-PLA2 is bound to atherogenic sdLDL particles and is a possible marker of sdLDL in plasma.16
Distribution of Lp-PLA2 between LDL and HDL is affected by various types of dyslipidemias.16
Lp-PLA2 levels may also be affected when Lp(a) plasma levels are greater than 30 mg/dL.16
How to reduce your Lp-PLA2:
A cross-sectional study of apparently healthy men and women demonstrated that Lp-PLA2 activity is influenced by a number of modifiable factors. Circulating levels of the enzyme were found to be positively associated with body weight and smoking, but inversely associated with increased consumption of alcohol and protein, and in women, with use of postmenopausal hormones.47
Decrease body fat
Do not smoke! Smoking increases Lp-PLA2
Appropriate alcohol intake – 1-2 glasses per day for men, and 1 for women
Consume appropriate amounts of protein
Hormone replacement therapy
Lp-PLA2 is lowered by statins and fenofibrate50-53
Niacinadded to established statin therapy lowers Lp-PLA2 levels by additional 20%54
Lp-PLA2 cut-point values for patients with known CVD
Alert cut-point of > 235 ng/mL8,9,32
Goal cut-point of < 200 ng/mL8,9
References
Demopoulos CA, Karantonis HC, Antonopoulou S. Platelet activating factor — a molecular link between atherosclerosis theories. Eur J Lipid Sci Technol 2003;105(11):705-16.
Prescott SM, Zimmerman GA, Stafforini DM, et al. Platelet-activating factor and related lipid mediators. Annu Rev Biochem 2000;69:419-45.
Tselepis AD, John Chapman M. Inflammation, bioactive lipids and atherosclerosis: potential roles of a lipoprotein-associated phospholipase A2, platelet activating factor-acetylhydrolase. Atheroscler Suppl 2002;3(4):57-68.
Stafforini DM, McIntyre TM, Carter ME, et al. Human plasma platelet-activating factor acetylhydrolase. Association with lipoprotein particles and role in the degradation of platelet-activating factor. J Biol Chem 1987;262(9):4215-22.
Ostermann G, Kostner GM, Gries A, et al. The contribution of individual lipoproteins to the degradation of platelet-activating factor in human serum. Haemostasis 1989;19(3):160-8.
Tew DG, Southan C, Rice SQ, et al. Purification, properties, sequencing, and cloning of a lipoprotein-associated, serine-dependent phospholipase involved in the oxidative modification of low-density lipoproteins. Arterioscler Thromb Vasc Biol 1996;16(4):591-9.
Tsimihodimos V, Karabina SA, Tambaki AP, et al. Altered distribution of platelet-activating factor- acetylhydrolase activity between LDL and HDL as a function of the severity of hypercholesterolemia. J Lipid Res 2002;43(2):256-63.
Caslake MJ, Packard CJ, Suckling KE, et al. Lipoprotein-associated phospholipase A(2), platelet-activating factor acetylhydrolase: a potential new risk factor for coronary artery disease. Atherosclerosis 2000;150(2):413-9.
MacPhee CH, Moores KE, Boyd HF, et al. Lipoprotein-associated phospholipase A2, platelet-activating factor acetylhydrolase, generates two bioactive products during the oxidation of low-density lipoprotein: use of a novel inhibitor. Biochem J 1999;338 ( Pt 2):479-87.
Murugesan G, Sandhya Rani MR, Gerber CE, et al. Lysophosphatidylcholine regulates human microvascular endothelial cell expression of chemokines. J Mol Cell Cardiol 2003;35(11):1375-84.
Wolfram Kuhlmann CR, Wiebke Ludders D, Schaefer CA, et al. Lysophosphatidylcholine-induced modulation of Ca(2+)-activated K(+)channels contributes to ROS-dependent proliferation of cultured human endothelial cells. J Mol Cell Cardiol 2004;36(5):675-82.
Chaudhuri P, Colles SM, Damron DS, et al. Lysophosphatidylcholine inhibits endothelial cell migration by increasing intracellular calcium and activating calpain. Arterioscler Thromb Vasc Biol 2003;23(2):218-23.
Lavi S, McConnell JP, Rihal CS, et al. Local production of lipoprotein-associated phospholipase A2 and lysophosphatidylcholine in the coronary circulation: association with early coronary atherosclerosis and endothelial dysfunction in humans. Circulation 2007;115(21):2715-21.
Mitsios JV, Vini MP, Stengel D, et al. Human platelets secrete the plasma type of platelet-activating factor acetylhydrolase primarily associated with microparticles. Arterioscler Thromb Vasc Biol 2006;26(8):1907-13.
Tellis CC, Tselepis AD. The role of lipoprotein-associated phospholipase A2 in atherosclerosis may depend on its lipoprotein carrier in plasma. Biochim Biophys Acta 2009;1791(5):327-38.
Garza CA, Montori VM, McConnell JP, et al. Association between lipoprotein-associated phospholipase A2 and cardiovascular disease: a systematic review. Mayo Clin Proc 2007;82(2):159-65.
Ballantyne CM, Hoogeveen RC, Bang H, et al. Lipoprotein-associated phospholipase A2, high-sensitivity C-reactive protein, and risk for incident coronary heart disease in middle-aged men and women in the Atherosclerosis Risk in Communities (ARIC) study. Circulation 2004;109(7):837-42.
Caslake MJ, Packard CJ, Robertson M, et al. Lipoprotein-associated phospholipase A(2), inflammatory biomarkers, and risk of cardiovascular disease in the Prospective Study of Pravastatin in the Elderly at Risk (PROSPER). Atherosclerosis 2010;210(1):28-34.
Ballantyne CM, Hoogeveen RC, Bang H, et al. Lipoprotein-associated phospholipase A2, high-sensitivity C-reactive protein, and risk for incident ischemic stroke in middle-aged men and women in the Atherosclerosis Risk in Communities (ARIC) study. Arch Intern Med 2005;165(21):2479-84.
McHugh VL, Barnhart SI, Schaper AM, et al.Improving risk prediction in primary prevention: the role of carotid ultrasound, hs-CRP, and Lp-PLA2. 46th Annual Conference on Cardiovascular Disease Epidemiology and Prevention. 2006. 113. e301-e81
May HT, Horne BD, Anderson JL, et al. Lipoprotein-associated phospholipase A2 independently predicts the angiographic diagnosis of coronary artery disease and coronary death. Am Heart J 2006;152(5):997-1003.
Yang EH, McConnell JP, Lennon RJ, et al. Lipoprotein-associated phospholipase A2 is an independent marker for coronary endothelial dysfunction in humans. Arterioscler Thromb Vasc Biol 2006;26(1):106-11.
Koenig W, Twardella D, Brenner H, et al. Lipoprotein-associated phospholipase A2 predicts future cardiovascular events in patients with coronary heart disease independently of traditional risk factors, markers of inflammation, renal function, and hemodynamic stress. Arterioscler Thromb Vasc Biol 2006;26(7):1586-93.
Koenig W, Khuseyinova N, Lowel H, et al. Lipoprotein-associated phospholipase A2 adds to risk prediction of incident coronary events by C-reactive protein in apparently healthy middle-aged men from the general population: results from the 14-year follow-up of a large cohort from southern Germany. Circulation 2004;110(14):1903-8.
Ballantyne C, Cushman M, Psaty B, et al. Collaborative meta-analysis of individual participant data from observational studies of Lp-PLA2 and cardiovascular diseases. Eur J Cardiovasc Prev Rehabil 2007;14(1):3-11.
Yusuf S, Hawken S, Ounpuu S, et al. Effect of potentially modifiable risk factors associated with myocardial infarction in 52 countries (the INTERHEART study): case-control study. Lancet 2004;364(9438):937-52.
Packard CJ, O’Reilly DS, Caslake MJ, et al. Lipoprotein-associated phospholipase A2 as an independent predictor of coronary heart disease. West of Scotland Coronary Prevention Study Group. N Engl J Med 2000;343(16):1148-55.
O’Donoghue M, Morrow DA, Sabatine MS, et al. Lipoprotein-associated phospholipase A2 and its association with cardiovascular outcomes in patients with acute coronary syndromes in the PROVE IT-TIMI 22 (PRavastatin Or atorVastatin Evaluation and Infection Therapy-Thrombolysis In Myocardial Infarction) trial. Circulation 2006;113(14):1745-52.
Brilakis ES, McConnell JP, Lennon RJ, et al. Association of lipoprotein-associated phospholipase A2 levels with coronary artery disease risk factors, angiographic coronary artery disease, and major adverse events at follow-up. Eur Heart J 2005;26(2):137-44.
Blake GJ, Dada N, Fox JC, et al. A prospective evaluation of lipoprotein-associated phospholipase A(2) levels and the risk of future cardiovascular events in women. J Am Coll Cardiol 2001;38(5):1302-6.
Pearson TA, Mensah GA, Alexander RW, et al. Markers of inflammation and cardiovascular disease: application to clinical and public health practice: A statement for healthcare professionals from the Centers for Disease Control and Prevention and the American Heart Association. Circulation 2003;107(3):499-511.
National Cholesterol Education Program (NCEP) Expert Panel on Detection, Evaluation, and Treatment of High Blood Cholesterol in Adults (Adult Treatment Panel III). Third Report of the National Cholesterol Education Program (NCEP) Expert Panel on Detection, Evaluation, and Treatment of High Blood Cholesterol in Adults (Adult Treatment Panel III) final report. Circulation 2002;106(25):3143-421.
Davidson MH, Corson MA, Alberts MJ, et al. Consensus panel recommendation for incorporating lipoprotein-associated phospholipase A2 testing into cardiovascular disease risk assessment guidelines. Am J Cardiol 2008;101(12A):51F-7F.
Karabina SA, Elisaf MC, Goudevenos J, et al. PAF-acetylhydrolase activity of Lp(a) before and during Cu(2+)-induced oxidative modification in vitro. Atherosclerosis 1996;125(1):121-34.
Gazi I, Lourida ES, Filippatos T, et al. Lipoprotein-associated phospholipase A2 activity is a marker of small, dense LDL particles in human plasma. Clin Chem 2005;51(12):2264-73.
Griffin BA. Lipoprotein atherogenicity: an overview of current mechanisms. Proc Nutr Soc 1999;58(1):163-9.
Zalewski A, Macphee C. Role of lipoprotein-associated phospholipase A2 in atherosclerosis: biology, epidemiology, and possible therapeutic target. Arterioscler Thromb Vasc Biol 2005;25(5):923-31.
Karabina SA, Elisaf M, Bairaktari E, et al. Increased activity of platelet-activating factor acetylhydrolase in low-density lipoprotein subfractions induces enhanced lysophosphatidylcholine production during oxidation in patients with heterozygous familial hypercholesterolaemia. Eur J Clin Invest 1997;27(7):595-602.
De Castellarnau C, Sanchez-Quesada JL, Benitez S, et al. Electronegative LDL from normolipemic subjects induces IL-8 and monocyte chemotactic protein secretion by human endothelial cells. Arterioscler Thromb Vasc Biol 2000;20(10):2281-7.
Anuurad E, Ozturk Z, Enkhmaa B, et al. Association of lipoprotein-associated phospholipase A2 with coronary artery disease in African- Americans and Caucasians. J Clin Endocrinol Metab 2010;95(5):2376-83.
Kolodgie FD, Burke AP, Skorija KS, et al. Lipoprotein-associated phospholipase A2 protein expression in the natural progression of human coronary atherosclerosis. Arterioscler Thromb Vasc Biol 2006;26(11):2523-9.
Berneis KK, Krauss RM. Metabolic origins and clinical significance of LDL heterogeneity. J Lipid Res 2002;43(9):1363-79.
Mannheim D, Herrmann J, Versari D, et al. Enhanced expression of Lp-PLA2 and lysophosphatidylcholine in symptomatic carotid atherosclerotic plaques. Stroke 2008;39(5):1448-55.
Vickers KC, Maguire CT, Wolfert R, et al. Relationship of lipoprotein-associated phospholipase A2 and oxidized low density lipoprotein in carotid atherosclerosis. J Lipid Res 2009;50(9):1735-43.
Safaya R, Chai H, Kougias P, et al. Effect of lysophosphatidylcholine on vasomotor functions of porcine coronary arteries. J Surg Res 2005;126(2):182-8.
Hatoum IJ, Nelson JJ, Cook NR, et al. Dietary, lifestyle, and clinical predictors of lipoprotein-associated phospholipase A2 activity in individuals without coronary artery disease. Am J Clin Nutr 2010;91(3):786-93.
Serruys PW, Garcia-Garcia HM, Buszman P, et al. Effects of the direct lipoprotein-associated phospholipase A(2) inhibitor darapladib on human coronary atherosclerotic plaque. Circulation 2008;118(11):1172-82.
McConnell JP, Jaffe AS. The spin stops here: inhibition of lipoprotein-associated phospholipase A2– a promising target but a negative initial trial? Clin Chem 2009;55(1):21-3.
Muhlestein JB, May HT, Jensen JR, et al. The reduction of inflammatory biomarkers by statin, fibrate, and combination therapy among diabetic patients with mixed dyslipidemia: the DIACOR (Diabetes and Combined Lipid Therapy Regimen) study. J Am Coll Cardiol 2006;48(2):396-401.
Albert MA, Glynn RJ, Wolfert RL, et al. The effect of statin therapy on lipoprotein associated phospholipase A2 levels. Atherosclerosis 2005;182(1):193-8.
Winkler K, Abletshauser C, Friedrich I, et al. Fluvastatin slow-release lowers platelet-activating factor acetyl hydrolase activity: a placebocontrolled trial in patients with type 2 diabetes. J Clin Endocrinol Metab 2004;89(3):1153-9.
Tsimihodimos V, Kakafika A, Tambaki AP, et al. Fenofibrate induces HDL-associated PAF-AH but attenuates enzyme activity associated with apoB-containing lipoproteins. J Lipid Res 2003;44(5):927-34.
Kuvin JT, Dave DM, Sliney KA, et al. Effects of extended-release niacin on lipoprotein particle size, distribution, and inflammatory markers in patients with coronary artery disease. Am J Cardiol 2006;98(6):743-5.
As discussed previously, apoB-containing LDL particles exist as a heterogeneous collection of variable sized particles, from small to large. There are technologies that size or measure peak particle diameters (in Angstroms or nanometers).1,2
Phenotype or Pattern A – Predominant LDL species is large. This is the one you want!
Phenotype or Pattern B (not to be confused with apoB) – Predominant LDL species is small3,4
Small, dense LDL (sdLDL), or more accurately small, dense LDL-cholesterol (sdLDL-C), is the cholesterol mass trafficked within the small LDL particles. It takes 40-70% more smaller LDLs than larger ones to traffic a given cholesterol mass, hence increased sdLDL-C is usually associated with high numbers of small LDL particles and total LDL-P.5
By definition, smaller lipoproteins are denser than larger species as there is more protein relative to the lipid content. Hence, the redundant term small LDL need not be always written as small, dense LDL. As sdLDL often traffics lipoprotein associated phospholipase A2 (Lp-PLA2), it is more prone to oxidative forces than large buoyant LDL and thus is likely more atherogenic.6,7
Studies have shown that elevated sdLDL particle concentration is associated with increased risk for coronary heart disease (CHD) even in the presence of optimal LDL-C values.3,5,8-10 However, when sdLDL-P concentrations are high, so is total LDL-P (apoB). sdLDL mass (particle number) plays a more important role in the progression of CHD than the LDL size, and sdLDL concentration serves as a powerful surrogate marker for CHD risk.8 By using the ratio of sdLDL-C to total LDL-C, it is easy to estimate the percentage of the total LDL-C that is made up of small dense particles.
Clinical Impact
Small, dense LDL particles are more easily modified by reactive oxygen species than larger LDL particles. They are more susceptible to oxidation, have a reduced affinity for the LDL receptors, and have increased clearance by scavenger receptors resulting in increased foam cell formation.5-8,11
Small LDLs also have a longer half-life than larger LDL particles. That means they stick around longer. Plus, their very small size may permit easier penetration of the endothelial wall.11
Moreover, small LDL particles are thought to be more readily retained in the artery wall, having a higher affinity for the proteoglycans that reside in this area.12,13
sdLDL and Blood Sugar
Small LDL particles may be observed in association with insulin resistance (IR) disorders such as obesity, the metabolic syndrome and prediabetes, and type 2 diabetes mellitus (T2DM), or in patients with renal dysfunction.14-32 Plasma/serum sdLDL levels are highest in the morning before breakfast; postprandial sdLDL levels are lower than fasting sdLDL, in part due to CETP-mediated TG-enrichment.33 After glucose ingestion, sdLDL levels are decreased.34 Trans-fat intake has also been shown to increase sdLDL levels.35
In addition to cross-sectional studies that have demonstrated an association between a predominance of small LDLs and increased risk for cardiovascular disease and diabetes mellitus, a reduction in LDL size has also been reported in patients with acute myocardial infarction, with angina pectoris as well as in those with non-coronary forms of atherosclerosis.36-40
sdLDL & Cardiovascular disease
If unadjusted for particle number, LDL size appears to be an important predictor of cardiovascular events and progression of coronary artery disease. Indeed, the predominance of small LDL was (in 2001) accepted as an emerging cardiovascular risk factor by the National Cholesterol Education Program Adult Treatment Panel III.41
However, data emerging from more recent studies shows that once adjusted for total LDL-P, LDL size is no longer an independent predictor of risk.39,42,43
Nevertheless, high sdLDL values, with elevated triglyceride levels and low high density lipoprotein (HDL)-C concentrations (also defined as disorders of the TG/HDL-C axis), constitute the “atherogenic lipoprotein phenotype (ALP),”3,9,41 a form of atherogenic dyslipidemia that is a feature of Type-2 Diabetes and the metabolic syndrome.11,13,41
The most important role of sdLDL in drug-naïve patients is as a marker of insulin resistance. Because smaller LDLs are cholesterol depleted, LDL-C or total cholesterol may not be increased in patients with diabetes, except for a slight increase of LDL-C in women.17
Subjects with a predominance of sdLDL have a greater than two-fold increased risk for developing type-2 diabetes mellitus, independent of age, sex, glucose tolerance and body mass index. Increases of peak LDL size were associated with a 16% decrease in the risk of developing Type-2 Diabetes.19
It has also been shown that patients with the insulin resistance syndrome have an elevated prevalence of the LDL “pattern B” phenotype20 and this has been confirmed for diabetes, in both men and women.21,22,44 In addition, when individuals were categorized as insulin-sensitive, insulin-resistant, or type 2 diabetic, more severe states of insulin resistance were associated with smaller LDL particle size.23,45 The reduction in LDL size occurs long before any glucose perturbation.
Therefore, the presence of both small LDL size and small LDL-P can be predictors of future T2DM.46
When Hulthe et al.47 assessed the prevalence of metabolic syndrome (using the World Health Organization definition) in a population-based sample of 58-year-old healthy men, the researchers found that LDL size was significantly smaller in subjects with the metabolic syndrome, compared to those without it.
In addition, subjects with pattern B had significantly higher mean values for body mass index, blood pressure, heart rate, serum cholesterol, triglyceride levels, and plasma insulin, and lower HDL levels compared with subjects with pattern A.
Subjects with pattern B also had a higher prevalence of moderate to large plaques in the carotid artery compared with subjects with pattern A. Decreasing LDL peak particle size was significantly associated with increasing carotid intima media thickening (CIMT) of the common carotid artery, the carotid artery bulb, and the common femoral artery. There was a statistically significant association between plaque occurrence and size and the LDL peak particle diameter in both the carotid and femoral arteries.45
Increased carotid intima media thickness (CIMT) is considered a reliable surrogate marker of early atherosclerosis and has been shown to correlate significantly with the presence of CHD and to predict coronary events.24,48,49 Berneis et al. (2005) found that LDL size was significantly associated with carotid IMT in patients with T2DM. LDL size was the second strongest predictor of IMT, after smoking, when compared with nine other cardiovascular risk factors, and was the strongest of all lipid parameters that were evaluated.50
However, this study was not adjusted for apoB or LDL-P. In another study, increased sdLDL-C level was a significant predictor of acute ischemic stroke (AIS) and in-hospital short-term mortality after AIS, a finding that persisted after adjustment for conventional risk factors (but not apoB). These results indicate that sdLDL predicts both AIS onset and consecutive short-term mortality, independent of traditional risk factors.51
Studies have demonstrated independent associations of both hepatic steatosis (HS) and the metabolic syndrome with LDL particle size, even after adjustment for apoB.12 LDL particle size is closely related with serum levels of TG, HDL cholesterol, and insulin resistance.45
Cholesterol Particles
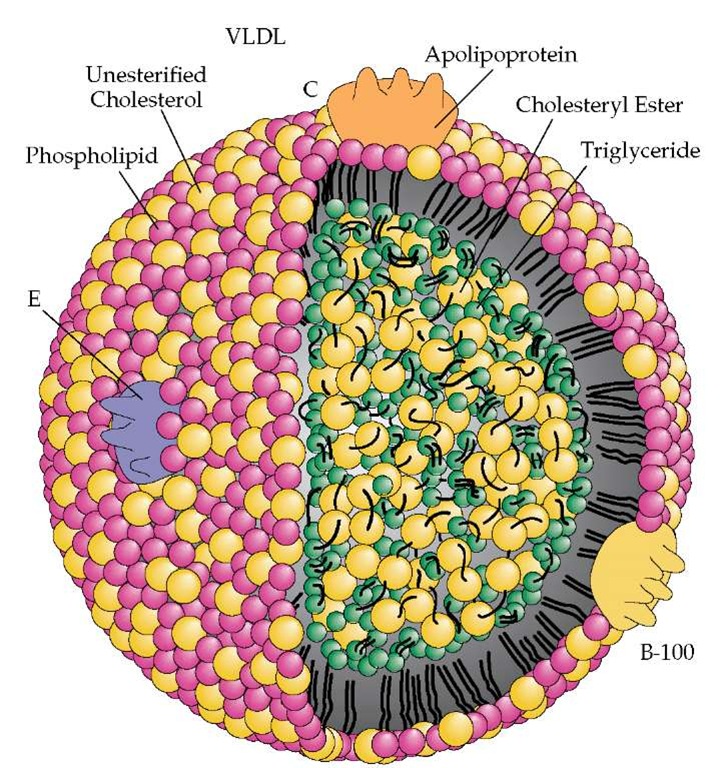
Large amounts of plasma TG are carried or transported by very low-density lipoprotein (VLDL) from liver or chylomicrons from the gut. These particles typically undergo delayed catabolism in insulin resistant patients, which allows cholesteryl ester transfer protein (CETP) to exchange the TG for cholesteryl ester (CE) in intermediate-density lipoproteins (IDLs), LDLs and HDLs.52
These latter particles thus become TG-rich and CE-poor. TG-rich HDL and LDL then undergo additional hydrolysis by hepatic lipase (a form of lipoprotein lipase or LPL), creating smaller HDL and LDL species. The very small HDL is further degraded and its structural apoA-I is excreted by the kidney, leading to decreased serum apoA-I, HDL-P and HDL-C.30 As for cardiovascular risk, both quality (i.e., LDL peak particle size) and quantity (apoB or LDL-P) of LDL were reported to be important equally and additively.53 It should also be noted that CETP activity results in CE enrichment of VLDL and postprandial chylomicron remnants.
The smaller LDL particle size in the subjects with hepatic steatosis alone could be explained by the concept of hepatic insulin resistance, which occurred primarily31 and more evidently54 than peripheral insulin resistance. Hepatic fat accumulation in HepG2 cells was found to induce serine phosphorylation of insulin receptor substrate (IRS)-1 and endoplasmic reticulum (ER) stress, as previously reported by the authors.32 The ER stress, in turn, led to the suppression of insulin receptor signaling, causing hepatic insulin resistance with no evident peripheral insulin resistance.
How To Reduce sdLDL
Although not specified as a goal of therapy in any guidelines, sdLDL levels may be reduced through a variety of different treatment options:
Diet (reducing intake of simple sugars and refined carbohydrates),11,35,43 exercise, and lifestyle modification (weight loss, smoking cessation).
Statin therapy, the standard first line drug for elevated apoB or sdLDL-C, can effectively reduce the number of LDL particles (the primary goal) but does not generally influence their size distribution. Although statins may increase sdLDL levels when triglycerides are low, this is likely of no concern if apoB and LDL-P reductions are substantial.
Other medications such as niacin, fenofibrate, high-dose omega-3 fatty acids, or a combination of medications (niacin + statin, fenofibrate + statin, or omega-3 + statin) can decrease sdLDL levels; however, only statin plus niacin reduces LDL-P beyond statin monotherapy.55,56
Treating glycemic abnormalities in diabetes and insulin resistance patients with insulin therapy can decrease sdLDL particles by reducing triglycerides in TG-rich lipoproteins. Thiazolidinedione insulin sensitizers, such as pioglitazone (off-label use) may have a similar action.
References
Menys VC, Liu Y, Mackness M, et al. Measurement of plasma small-dense LDL concentration by a simplified ultracentrifugation procedure and immunoassay of apolipoprotein B. Clinica Chimica Acta 2003;334:95–106
Hirano T, Ito Y, Yoshino G. Measurement of small dense low density lipoprotein particles. J Atheroscler Thromb 2005;12:67-72.
Austin MA, King MC, Vranizan KM, et al. Atherogenic lipoprotein phenotype. A proposed genetic marker for coronary heart disease risk. Circulation 1990;82:495–506.
Krauss RM, Burke DJ. Identification of multiple subclasses of plasma low density lipoproteins in normal humans. J Lipid Res 1982;23:97-104.
Taskinen MR. LDL-cholesterol, HDL-cholesterol or triglycerides – which is the culprit? Diab Res Clin Prac 2003;61:S19-S26.
De Graaf J, Hak-Lemmers HDL, Hectors MP, et al. Enhanced susceptibility to in vitro oxidation of the dense low-density lipoprotein subfraction in healthy subjects. Arterioscler Thromb 1991;11:298-306.
Tribble DL, Holl LG, Wood PD, et al. Variations in oxidative susceptibility among six low-density lipoprotein subfractions of differing density and particle size. Atherosclerosis 1992;93:189-199.
Koba S, Hirano T, Kondo T et al. Significance of small dense low-density lipoproteins and other risk factors in patients with various types of coronary heart disease. Am Heart J 2002;144(6):1026-35.
Rizzo M, Berneis K. Lipid triad or atherogenic lipoprotein phenotype: a role in cardiovascular prevention? J Atheroscler Thromb 2005;12:237–239.
Sattar N, Petrie JR, Jaap AJ. The atherogenic lipoprotein phenotype and vascular endothelial dysfunction. Atherosclerosis 1998;138:229–235.
Musunuru K. Atherogenic dyslipidemia: Cardiovascular risk and dietary intervention. Lipids 2010;45:907-914.
Anber V, Griffin BA, McConnell M, et al. Influence of plasma lipid and LDL-subfraction profile on the interaction between low density lipoprotein with human arterial wall proteoglycans. Atherosclerosis 1996; 124: 261-271.
Olin-Lewis K, Krauss RM, La Belle M, et al. ApoC-III content of apoB-containing lipoproteins is associated with binding to the vascular proteoglycan biglycan. J Lipid Res 2002;43:1969-1977.
Kim DS, Kim YK, et al. Low-density lipoprotein particle size in hepatic steatosis and metabolic syndrome. Diabetol Metab Syndr 2010;2:18.
Grundy SM, Cleeman JI, Daniels SR, et al. American Heart Association; National Heart, Lung, and Blood Institute. Diagnosis and management of the metabolic syndrome: an American Heart Association / National Heart, Lung, and Blood Institute Scientific Statement. Circulation 2005;112:2735–2752.
Syvanne M, Taskinen MR. Lipids and lipoproteins as coronary risk factors in non-insulin-dependent diabetes mellitus. Lancet 1997;350(Suppl 1):SI20–SI23.
U.K. Prospective Diabetes Study 27. Plasma Lipids and lipoproteins at diagnosis of NIDDM by age and sex. Diabetes Care 1997;20:1683–1687.
Friedlander Y, Kidron M, Caslake M, et al. Low density lipoprotein particle size and risk factors of insulin resistance syndrome. Atherosclerosis 2000;148:141–149.
Austin MA, Mykkanen L, Kuusisto J, et al. Prospective study of small LDLs as a risk factor for non-insulin dependent diabetes mellitus in elderly men and women. Circulation 1995;92:1770–1778.
Reaven GM, Chen YD, Jeppesen J, et al. Insulin resistance and hyperinsulinemia in individuals with small dense low-density lipoprotein particles. J Clin Invest 1993;92:141–146.
Feingold KR, Grunfeld C, Pang M, et al. LDL subclass phenotypes and triglyceride metabolism in non-insulin dependent diabetes. Arterioscler Thromb 1992;12:1496–1502.
Selby JV, Austin MA, Newman B, et al. LDL subclass phenotypes and the insulin resistance syndrome in women. Circulation 1993;88:381–387.
Garvey WT, Kwon S, Zheng D, et al. Effects of insulin resistance and type 2 diabetes on lipoprotein subclass particle size and concentration determined by nuclear magnetic resonance. Diabetes 2003;52:453–462.
Goya K, Kitamura T, Inaba M, et al. Risk factors for asymptomatic atherosclerosis in Japanese type 2 diabetic patients without diabetic microvascular complications. Metabolism 2003;52:1302–1306.
Niskanen L, Rauramaa R, Miettinen H, et al. Carotid artery intima-media thickness in elderly patients with NIDDM and in nondiabetic subjects. Stroke 1996;27:1986–1992.
Rizzo M, Barbagallo CM, Noto D, et al. Diabetes, family history and extension of coronary atherosclerosis are strong predictors of adverse events after PTCA: a one year follow-up study. Nutr Metab Cardiovasc Dis 2005;15:361–367.
Haffner SM, Mykkanen L, Robbins D, et al. A preponderance of small dense LDL is associated with specific insulin, proinsulin and the components of the insulin resistance syndrome in nondiabetic subjects. Diabetologia 1995;38:1328–1336.
Garin MC, Kalix B, Morabia A, et al. Small, dense lipoprotein particles and reduced paraoxonase-1 in patients with the metabolic syndrome. J Clin Endocrinol Metab 2005;90:2264–2269.
Slapikas R, Luksiene D, Slapikiene B, et al. Prevalence of cardiovascular risk factors in coronary heart disease patients with different low-density lipoprotein phenotypes. Medicina (Kaunas) 2005;41:925–931.
Ito MK. The metabolic syndrome: pathophysiology, clinical relevance, and use of niacin. Ann Pharmacother 2004;38(2):277-285.
Kim SP, Ellmerer M, Van Citters GW, et al. Primacy of hepatic insulin resistance in the development of the metabolic syndrome induced by an isocaloric moderate-fat diet in the dog. Diabetes 2003;52(10):2453-2460.
Kim DS, Jeong SK, Kim HR, et al. Effects of triglyceride on ER stress and insulin resistance. Biochem Biophys Res Commun 2007;363(1):140-145.
Ogita K, Ai M, Tanaka A, Ito Y, et al. Circadian rhythm of serum concentration of small dense low-density lipoprotein cholesterol. Clin Chim Acta 2007;376(1-2):76-41.
Ogita K, Ai M, Tanaka A, et al. Serum concentration of small dense low-density lipoprotein-cholesterol during oral glucose tolerance test and oral fat tolerance test. Clin Chim Acta 2008;387(1-2):76-41.
Jones JL, Comperatore M, Barona J, et al. A mediterranean-style, low-glycemic load diet decreases atherogenic lipoproteins and reduces lipoprotein(a) and oxidized low-density lipoprotein in women with metabolic syndrome. Metabolism 2011; Sep 22 [e-pub ahead of print].
Ai M, Otokowaza S, Asztalos BF, et al. Small dense LDL cholesterol and coronary heart disease: results from the Framingham Offspring Study. Clin Chem 2010;56(6):967-976.
Maeda S, Nakanishi S, Yoneda M, et al. Associations between small dense LDL, HDL subfractions (HDL2, HDL3) and risk of atherosclerosis in Japanese Americans. J Atheroscler Thromb 2011; Dec 21: e-pub ahead of print.
Suh S, Park HD, Kim SW, et al. Smaller mean particle size and higher proportion of small dense LDL in Korean type 2 diabetic patients. Diabetes Metab J 2011;35(5):536-542.
Mora S, Szklo M, Otvos JD, et al. LDL particle subclasses, LDL particle size and carotid atherosclerosis in the Multi-ethnic Study of Atherosclerosis (MESA). Atherosclerosis 2007;192:211-217.
Toft-Peterson AP, Tilsted HH, Aaroe J, et al. Small dense LDL particles – a predictor of coronary artery disease evaluated by invasive and CT-based techniques: a case-control study. Lipids Health Dis 2011;10:21.
National Cholesterol Education Program (NCEP). Expert panel on detection, evaluation, and treatment of high blood cholesterol in adults (adult treatment panel III). Third report of the National Cholesterol Education Program(NCEP) expert panel on detection, evaluation, and treatment of high blood cholesterol in adults (Adult Treatment Panel III) final report. Circulation 2002;106:3143–3421.
Otvos JD, Collins D, Freedman DS, et al. Low density lipoprotein and high density lipoprotein particle subclasses predict coronary events and are favorably changed by gemfibrozil therapy in the Veterans Affairs High-Density Intervention trial. Circulation 2006;113:1556-1563.
Cromwell WC, Otvos JD, Keyes MJ, et al. LDL particle number and risk of future cardiovascular disease in the Framingham Offspring Study—Implications for LDL management. J Clin Lipidol 2007;1:583–592.
Krauss RM. Dietary and genetic probes of atherogenic dyslipidemia. Arterioscler Thromb Vasc Biol 2005; 25: 2265–2272.
Chambless LE, Heiss G, Folsom AR, et al. Association of coronary heart disease incidence with carotid arterial wall thickness and major risk factors: the Atherosclerosis Risk in Communities (ARIC) Study, 1987–1993. Am J Epidemiol 1997;146:483–494.
Frazier-Wood AC, Garvey TW, Dall T, et al. Opportunities for using lipoprotein subclass profile by nuclear magnetic resonance spectroscopy in assessing insulin resistance and diabetes prediction. Metab Syndr Relat Disord 2012;10(4):244-51.
Hulthe J, Bokemark L, Wikstrand J, et al. The metabolic syndrome, LDL particle size, and atherosclerosis: the Atherosclerosis and Insulin Resistance (AIR) study. Arterioscler Thromb Vasc Biol 2000;20:2140–2147.
Craven TE, Ryu JE, Espeland MA, et al. Evaluation of the associations between carotid artery atherosclerosis and coronary artery stenosis. A case-control study. Circulation 1990;82:1230–1242.
Wofford JL, Kahl FR, Howard GR, et al. Relation of extent of extracranial carotid artery atherosclerosis as measured by B-mode ultrasound to the extent of coronary atherosclerosis. Arterioscler Thromb 1991;11:1786–1794.
Berneis K, Jeanneret C, Muser J, et al. Low-density lipoprotein size and subclasses are markers of clinically apparent and non-apparent atherosclerosis in type 2 diabetes. Metabolism 2005;54:227–234.
Zeljkovic A,Vekic J, Spasojevic-Kalimanovska V, et al. LDL and HDL subclasses in acute ischemic stroke: Prediction of risk and shortterm mortality. Atherosclerosis 2010;210(2):548-54.
Tall AR. Plasma cholesteryl ester transfer protein. J Lipid Res 1993;34(8):1255-1274.
Rizzo M, Berneis K. Low-density lipoprotein size and cardiovascular risk assessment. QJM 2006;99(1):1-14.
Samuel VT, Liu ZX, Qu X, et al. Mechanism of hepatic insulin resistance in non-alcoholic fatty liver disease. J Biol Chem 2004;279(31):32345-32353.
Backes JM, Gibson CA, Effect of lipid-lowering drug therapy on small-dense low-density lipoprotein. Ann Pharmacother 2005;39:523-526.
Maki KC, Bays HE, Dicklin MR et al. Effects of prescription omega-3 acid ethyl esters, coadministered with atorvastatin, on circulating levels of lipoprotein particles, apolipoprotein CIII, and lipoprotein-associated phospholipase A2 mass in men and women with mixed dyslipidemia. J Clin Lipidol 2011;5(6):483-92
C-Reactive Protein (CRP) is a blood test in our basic metabolic lab panel. Elevated levels of CRP are very common and most patients in our Tulsa, Oklahoma Functional Medicine Clinic want to know what they can do to reduce it.
What is CRP?
High sensitivity C-reactive protein (hs-CRP) is an acute-phase protein that increases in response to various inflammatory stimuli (e.g., trauma, infection, arthritis, and surgery).
CRP is a nonspecific inflammatory marker. Elevated levels may be caused by any medical condition resulting in inflammation, infection, or primary/secondary tissue injury.
When assessing cardiovascular risk:
Low Risk: < 1.0 mg/L
Intermediate Risk: 1.0- 3.0 mg/L
High Risk: > 3.0 mg/L
Patients with higher hs-CRP concentrations are more likely to develop stroke, myocardial infarction (MI), and severe peripheral vascular disease.
Inflammation & Atherosclerosis
Atherosclerosis is essentially a disease of chronic inflammation in the blood vessel. Arterial damage triggered by factors such as accumulated low-density lipoprotein (LDL), oxidative stress, hyperhomocysteinemia, and hypertension can lead to an inflammatory response.
This inflammatory response results in endothelial cell activation, a condition in which endothelial cells begin secreting increased amounts of proinflammatory chemicals such as vascular cell adhesion molecule 1 (VCAM-1) and monocyte chemoattractant protein 1 (MCP-1).
This causes immune cells and smooth muscle cells to migrate to inflamed areas and increase in number. Endothelial cell expression of macrophage colony stimulating factor (M-CSF) further contributes to atherogenesis by promoting the conversion of monocytes into macrophages in the areas of this inflammation.
The macrophages end up becoming foam cells after expressing scavenger receptors that allow them to engulf and modify lipoproteins. In turn, foam cells secrete additional inflammatory mediators that amplify inflammation in the vessel wall and weaken the protective fibrous cap of atherosclerotic plaque.
The inflammatory response also inhibits collagen production whilst stimulating macrophages to express tissue factor, a potent procoagulant. Therefore, Inflammation is essential to the formation of both atherosclerosis and its thrombotic complications.2
Inflammation & CRP
There is a pathway of inflammation that results in higher concentrations of various markers in peripheral blood.3 Systemic or local inflammation in blood vessels or tissue likely results in production of multipotent, primarily proinflammatory cytokines capable of inducing endothelial and other cells to produce adhesion molecules, procoagulant factors, and other mediators released into the circulation in soluble form.
These cytokines also stimulate production of interleukin 6 (IL-6), which stimulates the liver to produce acute-phase proteins, including CRP and serum amyloid A. The large increases in circulating levels of plasma CRP and serum amyloid A indicate major changes in the regulation of these genes as they respond to inflammation.
CRP and Cardiovascular Disease
Although circulating levels of several inflammatory mediators correlate with increased coronary risk, CRP has attracted particular attention.4,5 Plasma CRP has a long half-life in the circulation (~20 hours), high stability, and negligible circadian variability, and can be measured inexpensively using standardized high-sensitivity assays.6,7
CRP provides a functionally integrated assessment (exactly for what we are looking in Functional Medicine) of overall upstream cytokine activation. It also exhibits activities that may directly affect vascular disease, such as activation of the complement system.7
CRP is primarily secreted by the liver. However, it may also be produced by vascular sources, including cells residing in atherosclerotic plaques.
Studies Regarding CRP
Data from several prospective studies demonstrate that baseline plasma CRP levels predict the risk of future cardiovascular events in apparently healthy people, adding prognostic value beyond that of plasma lipids. 4,5,8
In the Physicians’ Health Study, elevated plasma CRP was associated with increased relative risk of MI in apparently healthy men, regardless of total cholesterol-to-high-density lipoprotein cholesterol (HDL-C) ratio.9
Similarly, in the Women’s Health Study (WHS; N ≈ 28,000), baseline plasma hs-CRP was superior to baseline plasma LDL-C for predicting first cardiovascular events over a mean of eight years.8 Plasma hs-CRP measurement was also found to aid risk prediction in 14,719 WHS participants with metabolic syndrome. Increased plasma hs-CRP was associated with an increased number of metabolic syndrome components as defined by ATP III guidelines (i.e., central obesity, elevated plasma triglycerides, low plasma HDL-C, hypertension, & elevated blood glucose).10
The advent of commercially available assays for hs-CRP allowed prompt confirmation of this marker as an independent predictor of future cardiovascular events and stroke in more than 30 diverse population cohorts.
The Monitoring of Trends and Determinants in Cardiovascular Disease (MONICA)- Augsberg Cohort,11,12 the National Health and Nutrition Examination Survey (NHANES),13 the Atherosclerosis Risk In Communities (ARIC) study,14 the European Prospective Investigation of Cancer (EPIC)-Norfolk study,15 the Health Professionals Follow-Up Study, the Nurses’ Health Study,16 the British General Practice Cohort,17 the Reykjavik Heart Study,18 the Honolulu Heart Study,19 the Cardiovascular Health Study,20 the Strong Heart Study,21 the Kuopio Ischemic Heart Disease Study,22 the Women’s Health Study,23 and the Framingham Heart Study.24,25
Moreover, several studies have now demonstrated the utility of CRP as a therapeutic target for reducing cardiovascular risk.
JUPITER Trial
Rosuvastatin therapy significantly reduced the incidence of cardiovascular events in apparently healthy persons without hyperlipidemia but with elevated hs-CRP.26
PROVE-IT & A-Z Trials
Data from both the Pravastatin or Atorvastatin Evaluation and Infection Therapy: Thrombolysis in Myocardial Infarction (PROVE IT–TIMI) trial and the A to Z (Aggrastat to Zocor) trial indicate that among patients with acute cardiac ischemia, the best clinical outcomes with statin therapy are achieved in those who not only reduce LDL-C to 70 mg/dL, but also reduce hs-CRP to 2 mg/L.27,28
REVERSAL Trial
Similarly, in the Reversing Atherosclerosis with Aggressive Lipid Lowering (REVERSAL) trial, regression of atherosclerosis after statin therapy was observed only among those who reduced both hs-CRP and LDL-C.29
These effects are particularly notable in prevention of stroke, for which reduction of LDL-C alone has been shown insufficient to mitigate risk.26,30 Collectively, these findings have prompted recommendations that therapeutic goals for statin-treated patients include low concentrations of both LDL-C and CRP.27
Treatment Considerations
Lifestyle:
Diet rich in plant sterols, soy protein, viscous fiber, and almonds
If your CRP result is > 3.0 mg/L, you should re-check it 2-4 weeks later, when you are free of infection or acute illness.1 The lower of the two results should then be used to establish a baseline hs-CRP value.
The presence of an acute inflammatory process must be considered if hs-CRP levels are markedly elevated (>10 mg/L); in this case, hs-CRP testing should be repeated after the acute process has resolved.1
References
Ridker PM. Cardiology Patient Page. C-reactive protein: a simple test to help predict risk of heart attack and stroke. Circulation 2003;108(12):e81-5.
Libby P, Ridker PM. Inflammation and atherosclerosis: role of C-reactive protein in risk assessment. Am J Med 2004;116 Suppl 6A:9S-16S.
Ridker PM, Hennekens CH, Buring JE, et al. C-reactive protein and other markers of inflammation in the prediction of cardiovascular disease in women. N Engl J Med 2000;342(12):836-43.
Libby P, Ridker PM, Maseri A. Inflammation and atherosclerosis. Circulation 2002;105(9):1135-43.
Ridker PM. Clinical application of C-reactive protein for cardiovascular disease detection and prevention. Circulation 2003;107(3):363-9.
Burgess LJ, Sulzer NU, Doubell AF. Primary prevention of atherosclerotic vascular disease. SA Pharmaceutical Journal 2006;74(7):12-7.
Ridker PM, Rifai N, Rose L, et al. Comparison of C-reactive protein and low-density lipoprotein cholesterol levels in the prediction of first cardiovascular events. N Engl J Med 2002;347(20):1557-65.
Ridker PM, Glynn RJ, Hennekens CH. C-reactive protein adds to the predictive value of total and HDL cholesterol in determining risk of first myocardial infarction. Circulation 1998;97(20):2007-11.
Ridker PM, Buring JE, Cook NR, et al. C-reactive protein, the metabolic syndrome, and risk of incident cardiovascular events: an 8-year follow-up of 14 719 initially healthy American women. Circulation 2003;107(3):391-7.
Koenig W, Sund M, Frohlich M, et al. C-Reactive protein, a sensitive marker of inflammation, predicts future risk of coronary heart disease in initially healthy middle-aged men: results from the MONICA (Monitoring Trends and Determinants in Cardiovascular Disease) Augsburg Cohort Study, 1984 to 1992. Circulation 1999;99(2):237-42.
Koenig W, Lowel H, Baumert J, et al. C-reactive protein modulates risk prediction based on the Framingham Score: implications for future risk assessment: results from a large cohort study in southern Germany. Circulation 2004;109(11):1349-53.
Ford ES, Giles WH. Serum C-reactive protein and self-reported stroke: findings from the Third National Health and Nutrition Examination Survey. Arterioscler Thromb Vasc Biol 2000;20(4):1052-6.
Ballantyne CM, Hoogeveen RC, Bang H, et al. Lipoprotein-associated phospholipase A2, high-sensitivity C-reactive protein, and risk for incident coronary heart disease in middle-aged men and women in the Atherosclerosis Risk in Communities (ARIC) study. Circulation 2004;109(7):837-42.
Boekholdt SM, Hack CE, Sandhu MS, et al. C-reactive protein levels and coronary artery disease incidence and mortality in apparently healthy men and women: the EPIC-Norfolk prospective population study 1993-2003. Atherosclerosis 2006;187(2):415-22.
Pai JK, Pischon T, Ma J, et al. Inflammatory markers and the risk of coronary heart disease in men and women. N Engl J Med 2004;351(25):2599-610.
Danesh J, Whincup P, Walker M, et al. Low grade inflammation and coronary heart disease: prospective study and updated metaanalyses. BMJ 2000;321(7255):199-204.
Danesh J, Wheeler JG, Hirschfield GM, et al. C-reactive protein and other circulating markers of inflammation in the prediction of coronary heart disease. N Engl J Med 2004;350(14):1387-97.
Curb JD, Abbott RD, Rodriguez BL, et al. C-reactive protein and the future risk of thromboembolic stroke in healthy men. Circulation 2003;107(15):2016-20.
Cushman M, Arnold AM, Psaty BM, et al. C-reactive protein and the 10-year incidence of coronary heart disease in older men and women: the cardiovascular health study. Circulation 2005;112(1):25-31.
Best LG, Zhang Y, Lee ET, et al. C-reactive protein as a predictor of cardiovascular risk in a population with a high prevalence of diabetes: the Strong Heart Study. Circulation 2005;112(9):1289-95.
Laaksonen DE, Niskanen L, Nyyssonen K, et al. C-reactive protein in the prediction of cardiovascular and overall mortality in middle-aged men: a population-based cohort study. Eur Heart J 2005;26(17):1783-9.
Everett BM, Kurth T, Buring JE, et al. The relative strength of C-reactive protein and lipid levels as determinants of ischemic stroke compared with coronary heart disease in women. J Am Coll Cardiol 2006;48(11):2235-42.
Wilson PW, Pencina M, Jacques P, et al. C-reactive protein and reclassification of cardiovascular risk in the Framingham Heart Study. Circ Cardiovasc Qual Outcomes 2008;1(2):92-7.
Rost NS, Wolf PA, Kase CS, et al. Plasma concentration of C-reactive protein and risk of ischemic stroke and transient ischemic attack: the Framingham study. Stroke 2001;32(11):2575-9.
Ridker PM, Danielson E, Fonseca FA, et al. Rosuvastatin to prevent vascular events in men and women with elevated C-reactive protein. New England Journal of Medicine 2008;359(21):2195-207.
Ridker PM, Cannon CP, Morrow D, et al. C-reactive protein levels and outcomes after statin therapy. N Engl J Med 2005;352(1):20-8.
Morrow DA, de Lemos JA, Sabatine MS, et al. Clinical relevance of C-reactive protein during follow-up of patients with acute coronary syndromes in the Aggrastat-to-Zocor Trial. Circulation 2006;114(4):281-8.
Nissen SE, Tuzcu EM, Schoenhagen P, et al. Statin therapy, LDL cholesterol, C-reactive protein, and coronary artery disease. N Engl J Med 2005;352(1):29-38.
Mega JL, Morrow DA, Cannon CP, et al. Cholesterol, C-reactive protein, and cerebrovascular events following intensive and moderate statin therapy. J Thromb Thrombolysis 2006;22(1):71-6
Fibrinogen is a soluble precursor of the insoluble fibrin, the major component of a blood clot. Fibrinogen is a glycoprotein, which consists of three pairs of polypeptide chains, Aa, Bb, and γ.2
Different ways to measure fibrinogen
Several laboratory methods exist to determine fibrinogen levels, including clot-based methods and immunoassays such as RIA, nephelometric, and EIA methods. The clot-based method measures functional fibrinogen, while immunoassays measure antigenic fibrinogen, which may or may not be able to participate in clot formation. Therefore, different methods may give results that vary from each other.
The immunoturbidimetric method uses antibodies directed against fibrinogen to detect and quantify levels of fibrinogen and expresses the results in mg/dL. This test is not a functional fibrinogen test. In the Framingham offspring study, the immunologic method for fibrinogen showed a stronger association with cardiovascular disease than the clot-based method, suggesting that it may be a useful screening tool to identify individuals at increased thrombotic risk.1
Fibrinogen contributes to Cardiovascular disease
Risk factors for cardiovascular disease lead to endothelial dysfunction, which coincides with uncoupling of endothelial nitric oxide synthase (eNOS) and the simultaneous production of reactive oxygen species from intracellular sources such as NADPH oxidase. A local inflammatory cascade is triggered, with the production of cytokines and growth factors by inflammatory cells, which in turn leads to intima thickening (see CIMT), smooth-muscle cell proliferation, and extracellular matrix destabilization.
Apart from the contribution to the coagulation cascade, fibrinogen participates in the formation of atherosclerotic plaque in its early stages, since it can directly incorporate in the arterial wall and turn into fibrin as well as decomposition products. Additionally, it binds to high-density lipoprotein (HDL) and produces even greater amounts of it.4
Simultaneously, fibrinogen, as well as its decomposition products, mediate the transportation of adhesion molecules in the surface of endothelium and their further migration to the intima.5 The binding of macrophages to these adhesion molecules is the first step in atherosclerosis.
It should be mentioned that fibrinogen and the products of its decomposition, trigger proliferation and migration of smooth-muscle cells.6-8 In regard to the inflammatory aspect of fibrinogen, the inflammatory process is mainly mediated by the interaction of fibrinogen-leukocytes mediated by integrins.
The two main receptors of fibrinogen on the surface of leukocytes include MAC 1 and alpha X beta 2. Monocytes are able to induce the junction of fibrinogen to the receptor MAC–1.9,10 The ability of the receptor MAC–1 to attach to fibrinogen is a result of changes that slip into the receptor during the process of cellular proliferation.
Furthermore, fibrinogen binds to the intracellular adhesion molecule 1 (ICAM-1) and increases the interaction between monocytes and endothelial cells. Through this process, ICAM-1 forms a binding molecule of the cellular surface for MAC–1 integrin and has an important role in the adhesion of leukocytes on vascular endothelium.11-13 Additionally, fibrinogen increases the concentration of ICAM-1 proteins on the surface of endothelial cells leading to the rise of leukocytes on the surface of endothelial cells, even in conditions characterized by the presence of increased shear stress.14
Moreover, the binding of fibrinogen to ICAM-1 mediates platelet adhesion. The interaction of fibrinogen with the cells that express ICAM-1 is linked to augmented cell proliferation.15 Upon its binding to the surface receptor of leukocytes, fibrinogen promotes a chemotactic response playing a crucial role in inflammatory process.16
One of the proposed mechanisms through which fibrinogen induces inflammatory changes in leukocytes includes the rise of intracellular calcium and increased expression of neutrophil activation factors. These processes result to increased phagocytosis, leukocyte toxicity (mediated by antibodies), and delay of apoptosis.17
Interpretation
Several studies have examined the role of fibrinogen levels in the prediction of atherosclerosis and future cardiovascular disease (CVD) events.
Framingham Study
The Framingham study18,19 found that fibrinogen levels were linked to cardiovascular risk. In males, as well as females, the risk for MI and stroke increased progressively along with fibrinogen levels. The effect of fibrinogen levels on cardiovascular risk was even greater in young individuals. In addition, it has been shown that its effect was similar to the effect of known risk factors such as hypertension, diabetes mellitus, and smoking. Additionally, it is an independent predictive marker for coronary artery disease (CAD). For both sexes, the risk of cardiovascular disease was correlated positively to antecedent fibrinogen values higher than the 1.3 to 7.0 g/L (126 to 696 mg/dL) range.
ECAT Study
Interestingly, the magnitude of the risk diminished with advancing age in women, but not in men. Many years after the Framingham study, the ECAT study20 showed that plasma fibrinogen was a strong and independent risk factor for MI and sudden death, particularly in patients with pre-existing CAD. The association between fibrinogen and future coronary events was characterized by an odds ratio of 1.31 (95% CI, 1.07-1.61).
Fibrinogen Studies Collaboration
Recently, a meta-analysis of the Fibrinogen Studies Collaboration21 recruiting subjects without history of CVD reported that the age- and sex-adjusted hazard ratio for 1 g/L increase of fibrinogen levels for CAD was 2.42 (95% CI, 2.24-2.60), stroke 2.06 (95% CI, 1.83-2.33), other vascular mortality 2.76 (95% CI, 2.28-3.35), and other non-vascular mortality 2.03 (95% CI, 1.90-2.18). Further information regarding the potency of fibrinogen in predicting future CVD events has been offered through other studies.
AtheroGene Study
The AtheroGene study22 aimed to evaluate the potential clinical use of CRP and fibrinogen in patients already suffering from CAD. Fibrinogen was associated with future cardiovascular events, such as an increment of one standard deviation of fibrinogen with a 1.27-fold (95% CI 1.12–1.43, p < 0.0005) increase in HR in the models adjusted for age and sex.
Retterstol Study
Additive to the results of the Atherogene study were the results of Retterstol et al.23 After adjusting for age, ejection fraction, total serum cholesterol, smoking, and hypertension, patients in the top quartile of fibrinogen (> or = 4.0 g/L) had a relative risk (RR) of 1.8 (95% CI 1.0- 3.6, p = 0.07) for death of all causes. The top quartile of fibrinogen was a stronger predictor of cardiac death, RR = 2.2 (95% CI 1.1-4.4, p = 0.03), while the effect on the endpoint major cardiac event was not significant, RR = 1.1 (95% CI 0.6-1.9, p = 0.69).
ARIC Study
Moreover, the ARIC study24 evaluated the relationship of fibrinogen levels with the risk of peripheral artery disease (PAD) in patients with diabetes mellitus, but not PAD. The results showed that the adjusted RR for the highest quartiles of fibrinogen was 1.70 (95% CI: 1.17-2.47). Furthermore, an interesting study by Panagiotakos et al.25 showed that in individuals with heterozygous familial hypercholesterolemia, fibrinogen levels are among the strong predictors of CHD. Finally, it appears that thrombotic and inflammatory mechanisms are probably both implicated in the effects of fibrinogen as this has been evaluated by several studies,13-17 indicating that this acute-phase glycoprotein is able to act as an inflammatory as well as a thrombotic marker.
Treatment
Lifestyle factors that have been shown to lower circulating fibrinogen include:
Weight loss (as appropriate)2
Smoking cessation2
Exercise2,33
Diet rich in fruits, vegetables, and whole grains (e.g., Traditional Mediterranean diet)34
Moderate alcohol intake (dependent on ApoE genotype)2,34,35
Increased intake of omega-3 fatty acids2,36-39
Increased consumption of magnesium-rich foods40
Stress management2
Although fibrinogen is not a primary therapeutic target, certain medications indicated for treatment of other CVD risk factors have been shown to lower circulating concentrations of this marker. Use of these medications to treat underlying conditions (e.g., dyslipidemia, prediabetes, diabetes) may have a beneficial effect on fibrinogen levels:
Stec JJ, Silbershatz H, et al. Association of fibrinogen with cardiovascular risk factors and cardiovascular disease in the Framingham Offspring Population. Circulation 2000;102(14):1634-8.
Stefanadi E, Tousoulis D, et al. Inflammatory biomarkers predicting events in atherosclerosis. Curr Med Chem 2010;17(16):1690-707.
Ernst E, Resch KL. Fibrinogen as a cardiovascular risk factor: a meta-analysis and review of the literature. Ann Intern Med 1993;118(12):956-63.
Miyao Y, Yasue H, et al. Elevated plasma interleukin-6 levels in patients with acute myocardial infarction. Am Heart J 1993;126(6):1299-304.
Smith EB, Keen GA, et al. Fate of fibrinogen in human arterial intima. Arteriosclerosis 1990;10(2):263-75.
Stroncek DF, Shankar RA, et al. The subcellular distribution of myeloid-related protein 8 (MRP8) and MRP14 in human neutrophils. J Transl Med 2005;3:36.
Thompson WD, Smith EB. Atherosclerosis and the coagulation system. J Pathol 1989;159(2):97-106.
Altieri DC, Bader R, et al. Oligospecificity of the cellular adhesion receptor Mac-1 encompasses an inducible recognition specificity for fibrinogen. J Cell Biol 1988;107(5):1893-900.
Colman RW. Interactions between the contact system, neutrophils and fibrinogen. Adv Exp Med Biol 1990;281:105-20.
van de Stolpe A, Jacobs N, et al. Fibrinogen binding to ICAM-1 on EA.hy 926 endothelial cells is dependent on an intact cytoskeleton. Thromb Haemost 1996;75(1):182-9.
Duperray A, Languino LR, et al. Molecular identification of a novel fibrinogen binding site on the first domain of ICAM-1 regulating leukocyte-endothelium bridging. J Biol Chem 1997;272(1):435-41.
Harley SL, Sturge J, et al. Regulation by fibrinogen and its products of intercellular adhesion molecule-1 expression in human saphenous vein endothelial cells. Arterioscler Thromb Vasc Biol 2000;20(3):652-8.
Kaperonis EA, Liapis CD, et al. Inflammation and atherosclerosis. Eur J Vasc Endovasc Surg 2006;31(4):386-93.
Gardiner EE, D’Souza SE. A mitogenic action for fibrinogen mediated through intercellular adhesion molecule-1. J Biol Chem 1997;272(24):15474-80.
Forsyth CB, Solovjov DA, et al. Integrin alpha(M)beta(2)-mediated cell migration to fibrinogen and its recognition peptides. J Exp Med 2001;193(10):1123-33.
Rubel C, Fernandez GC, et al. Fibrinogen promotes neutrophil activation and delays apoptosis. J Immunol 2001;166(3):2002-10.
Kannel WB, D’Agostino RB, et al. Diabetes, fibrinogen, and risk of cardiovascular disease: the Framingham experience. Am Heart J 1990;120(3):672-6.
Kannel WB, Wolf PA, et al. Fibrinogen and risk of cardiovascular disease. The Framingham Study. JAMA 1987;258(9):1183-6.
Juhan-Vague I, Thompson SG, et al. Involvement of the hemostatic system in the insulin resistance syndrome. A study of 1500 patients with angina pectoris. The ECAT Angina Pectoris Study Group. Arterioscler Thromb 1993;13(12):1865-73.
Fibrinogen Studies C, Danesh J, et al. Plasma fibrinogen level and the risk of major cardiovascular diseases and nonvascular mortality: an individual participant meta-analysis. JAMA 2005;294(14):1799-809.
Sinning JM, Bickel C, et al. Impact of C-reactive protein and fibrinogen on cardiovascular prognosis in patients with stable angina pectoris: the AtheroGene study. Eur Heart J 2006;27(24):2962-8.
Retterstol L, Kierulf P, et al. Plasma fibrinogen level and long-term prognosis in Norwegian middle-aged patients with previous myocardial infarction. A 10 year follow-up study. J Intern Med 2001;249(6):511-8.
Wattanakit K, Folsom AR, et al. Risk factors for peripheral arterial disease incidence in persons with diabetes: the Atherosclerosis Risk in Communities (ARIC) Study. Atherosclerosis 2005;180(2):389-97.
Panagiotakos DB, Pitsavos C, et al. Importance of LDL/HDL cholesterol ratio as a predictor for coronary heart disease events in patients with heterozygous familial hypercholesterolaemia: a 15-year follow-up (1987-2002). Curr Med Res Opin 2003;19(2):89-94.
Meade TW, Mellows S, et al. Haemostatic function and ischaemic heart disease: principal results of the Northwick Park Heart Study. Lancet 1986;2(8506):533-7.
Heinrich J, Balleisen L, et al. Fibrinogen and factor VII in the prediction of coronary risk. Results from the PROCAM study in healthy men. Arterioscler Thromb 1994;14(1):54-9.
Benderly M, Graff E, et al. Fibrinogen is a predictor of mortality in coronary heart disease patients. The Bezafibrate Infarction Prevention (BIP) Study Group. Arterioscler Thromb Vasc Biol 1996;16(3):351-6.
Woodward M, Lowe GD, et al. Fibrinogen as a risk factor for coronary heart disease and mortality in middle-aged men and women. The Scottish Heart Health Study. Eur Heart J 1998;19(1):55-62.
Sharp DS, Abbott RD, et al. Plasma fibrinogen and coronary heart disease in elderly Japanese-American men. Arterioscler Thromb Vasc Biol 1996;16(2):262-8.
Levenson J, Giral P, et al. Fibrinogen and silent atherosclerosis in subjects with cardiovascular risk factors. Arterioscler Thromb Vasc Biol 1995;15(9):1263-8.
Woodward M, Lowe GD, et al. Epidemiology of coagulation factors, inhibitors and activation markers: The Third Glasgow MONICA Survey. II. Relationships to cardiovascular risk factors and prevalent cardiovascular disease. Br J Haematol 1997;97(4):785-97.
Rodriguez Cristobal JJ, Alonso-Villaverde Grote C, et al. Randomised clinical trial of an intensive intervention in the primary care setting of patients with high plasma fibrinogen in the primary prevention of cardiovascular disease. BMC Res Notes 2012;5:126.
Chrysohoou C, Panagiotakos DB, et al. Adherence to the Mediterranean diet attenuates inflammation and coagulation process in healthy adults: The ATTICA Study. J Am Coll Cardiol 2004;44(1):152-8.
Imhof A, Woodward M, et al. Overall alcohol intake, beer, wine, and systemic markers of inflammation in western Europe: results from three MONICA samples (Augsburg, Glasgow, Lille). Eur Heart J 2004;25(23):2092-100.
Hassen LJ, Ueshima H, et al. Significant inverse association of marine n-3 fatty acids with plasma fibrinogen levels in Japanese in Japan but not in whites or Japanese Americans. Eur J Clin Nutr 2012;66(3):329-35.
Kalogeropoulos N, Panagiotakos DB, et al. Unsaturated fatty acids are inversely associated and n-6/n-3 ratios are positively related to inflammation and coagulation markers in plasma of apparently healthy adults. Clin Chim Acta 2010;411(7-8):584-91.
Derosa G, Maffioli P, et al. Effects of long chain omega-3 fatty acids on metalloproteinases and their inhibitors in combined dyslipidemia patients. Expert Opin Pharmacother 2009;10(8):1239-47.
Hartweg J, Farmer AJ, et al. Potential impact of omega-3 treatment on cardiovascular disease in type 2 diabetes. Curr Opin Lipidol 2009;20(1):30-8.
Moslehi N, Vafa M, et al. Effects of oral magnesium supplementation on inflammatory markers in middle-aged overweight women. J Res Med Sci 2012;17(7):607-14.
Guyton JR, Blazing MA, et al. Extended-release niacin vs gemfibrozil for the treatment of low levels of high-density lipoprotein cholesterol. Niaspan-Gemfibrozil Study Group. Arch Intern Med 2000;160(8):1177-84.
Chesney CM, Elam MB, et al. Effect of niacin, warfarin, and antioxidant therapy on coagulation parameters in patients with peripheral arterial disease in the Arterial Disease Multiple Intervention Trial (ADMIT). Am Heart J 2000;140(4):631-6.
Tanne D, Benderly M, et al. A prospective study of plasma fibrinogen levels and the risk of stroke among participants in the bezafibrate infarction prevention study. Am J Med 2001;111(6):457-63.
Krysiak R, Gdula-Dymek A, et al. Effect of metformin on selected parameters of hemostasis in fenofibrate-treated patients with impaired glucose tolerance. Pharmacol Rep 2013;65(1):208-13.
Krysiak R, Okopien B. Haemostatic effects of metformin in simvastatin-treated volunteers with impaired fasting glucose. Basic Clin Pharmacol Toxicol 2012;111(6):380-4.
Apolipoprotein A-I (apoA-I) is the major protein component of high-density lipoprotein (HDL) in plasma. HDL particles can carry from one to four apoA-I molecules per particle. The liver and intestine synthesize lipid-poor apoA-I. The protein promotes cholesterol efflux from tissues (via the adenosine triphosphate-binding cassette transporter A1 [ABCA1] transporter) to the liver for excretion. ApoA-I is a cofactor for lecithin: cholesterol acyltransferase (LCAT) which is responsible for the formation of most plasma cholesteryl esters. ApoA-I is also a ligand for scavenger receptor type B1 (SR-B1). ApoA-I was also isolated as a prostacyclin (PGI2) stabilizing factor, and thus may have an anti-clotting effect.3 Defects in the gene that encodes apoA-I are associated with HDL deficiencies and systemic non-neuropathic amyloidosis.4
ApoA-I is a single polypeptide of 243 amino acid residues. Its sequence, as reported by Brewer et al.8 differs in several positions from earlier reports by Baker et al.9 ApoA-I contains no carbohydrate and has a molecular weight of approximately 28,000. This apolipoprotein has been reported to activate lecithin: cholesterol acyltransferase (LCAT), the enzyme that is responsible for cholesterol esterification in plasma. The other major HDL-associated protein, apoA-II, has a molecular weight of approximately 17,000 and consists of two identical 77-amino-acid peptide chains attached by a single disulfide bond. ApoA-II also contains no carbohydrate. Both apoA-I and apoA-II can self-associate in aqueous solutions, and this self-association results in major changes in secondary structure. ApoA-I is much more readily dissociated from HDL particles by ultracentrifugation than is apoA-II. Both apoA-I and apoA-II can combine with lecithin to form protein-phospholipid complexes with a hydrated density of HDL. ApoA-I also attaches to chylomicron surfaces and is released as the particle undergoes lipoprotein lipase-induced lipolysis.
The liver and intestine synthesize lipid-poor apoA-I, which can interact with the ABCA1 located on the arterial macrophages, transporting free cholesterol to the extracellular lipid poor HDL. Lipidation of the HDL particles generates HDL2.
Clinical Interpretation
Studies have compared the interaction of HDL and apoA-I with macrophages. While HDL binds to the cells, for example, via SR-BI, without being further internalized, apoA-I binding, cell association and internalization correlate with ABCA1 expression. The expression and regulation of these two receptors ensures that both lipid- free apoA-I and HDL can remove excess cholesterol from macrophages under different circumstances.9
The role of HDL and its major apolipoprotein apoA-I in cholesterol efflux from macrophages has been studied extensively, but the molecular details underlying this interaction are still incompletely understood. Lorenzi et al.7compared the interactions of apoA-I and HDL with RAW264.7 macrophages, a cell system previously evolved as a well-accepted model for the study of cholesterol homeostasis in macrophages. Evaluation of the interactions between apoA-I and HDL with ABCA1 and SR-BI demonstrated that macrophages specifically bind HDL and apoA-I.7 While HDL competes for apoA-I binding, apoA-I is not a competitor for HDL binding. This observation suggests that HDL and apoA-I are binding to macrophages, at least in part, through distinct receptors. For and lipid-free apoA-I are poor ligands for SR-BI, explaining the lack of competition of HDL could be available for the competition of the apoA-I binding site by HDL.7 ApoE, and possibly lipoprotein X, are also cholesterol acceptor proteins.
SR-BI is recognized as the receptor that mediates selective uptake of cholesterol esters from HDL by the liver and steroidogenic organs.16,17 Moreover, SR-BI is a multi-functional, multi-ligand receptor that facilitates the binding of a wide array of native and modified lipoproteins. These findings not only suggest that HDL and apoA-I are interacting with distinct receptors, namely, SR-BI and ABCA1, but also that the interaction might be of specific importance under different conditions of altered cholesterol homeostasis. Moreover, it has been shown that the relative proportions of lipid-free apolipoproteins and mature HDL in the plasma can affect the relative activities of ABCA1- and SR-BI-mediated cholesterol efflux.12,13
Overexpression of ABCA1 has been shown to increase apoA-I binding to the cell surface.13 The direct interaction of apoA-I with ABCA1 is further supported by the study of both ABCA1 and apoA-I mutants. All ABCA1 mutants, except ABCA1 (WS590S), which fail to promote cholesterol efflux, also fail to cross-link apoA-I.8,14
The apoA family constitute the major proteins found in HDL and triglyceride-rich lipoproteins. ApoA, as part of HDL, is involved in the removal of free cholesterol from extrahepatic tissues and also plays a role in the activation of LCAT. ApoA activates the enzymes driving cholesterol transfer from the tissues into HDL and is also involved in HDL recognition and receptors binding in the liver.2 There are multiple forms of apoA, the most common being apoA-I and apoA-II. ApoA-I is the major “A” apolipoprotein attached to HDL. ApoA-I is found in greater proportion than apoA-II (about 3 to 1).3 The apoA-I concentration can be measured directly and corresponds with HDL levels. Lower levels of apoA commonly correlate with the presence of CAD and peripheral vascular disease.
ApoA-I may be a better predictor of atherogenic risk than HDL-C.4 Certain genetic disorders cause apoA-I deficiencies and associated low levels of HDL. These patients also tend to have hyperlipidemia with elevated LDL, which contributes to accelerated rates of atherosclerosis.
Treatment Considerations
The apolipoproteins within HDL are significant determinants of its function. Although not proven, therapeutic strategies that selectively increase apoA-I levels (HDL-P) may be more atheroprotective than those that increase levels of both apoA-I and apoA-II.9
Drugs (e.g., androgens, beta blockers, diuretics, and progestins)
Familial hypoalphalipoproteinemia
Smoking
Uncontrolled diabetes2
References
Fruchart JC, De GC, Delfly B, Castro GR. Apolipoprotein A-I-containing particles and reverse cholesterol transport: evidence for connection between cholesterol efflux and atherosclerosis risk. Atherosclerosis 1994;110 Suppl:S35-S39.
Castellani LW, Goto AM, Lusis AJ. Studies with apolipoprotein A-II transgenic mice indicate a role for HDLs in adiposity and insulin resistance. Diabetes 2001;50(3):643-51.
Patsch W, Brown SA, Morrisett JD, Gotto AM, Jr., Patsch JR. A dual-precipitation method evaluated for measurement of cholesterol in high-density lipoprotein subfractions HDL2 and HDL3 in human plasma. Clin Chem 1989;35(2):265-70.
Gotto AM, Jr., Whitney E, Stein EA, et al. Relation between baseline and on-treatment lipid parameters and first acute major coronary events in the Air Force/Texas Coronary Atherosclerosis Prevention Study (AFCAPS/TexCAPS). Circulation 2000;101(5):477-84.
Wakatsuki A, Ikenoue N, Sagara Y. Effect of estrogen on the size of low-density lipoprotein particles in postmenopausal women. Obstet Gynecol 1997; 90(1):22-5.
Rodriguez-Aleman F, Torres JM, Cuadros JL, Ruiz E, Ortega E. Effect of estrogenprogestin replacement therapy on plasma lipids and lipoproteins in postmenopausal women. Endocr Res 2000;26(2):263-73.
Lorenzi I, von Eckardstein A, Cavelier C, Radosavljevic S, Rohrer L. Apolipoprotein A-I but not high-density lipoproteins are internalised by RAW macrophages: roles of ATP-binding cassette transporter A1 and scavenger receptor. BIJ Mol Med 2008;86:171–183.
Shah PK, Kaul S, Nilsson J, Cercek B. Exploiting the vascular protective effects of high-density lipoprotein and its apolipoproteins: an idea whose time for testing is coming, part I. Circulation 2001;104 (19):2376-2383.
Meyers CD, Kashyap ML. Pharmacologic elevation of high-density lipoproteins: recent insights on mechanism of action and atherosclerosis protection. Curr Opin Cardiol 2004;19(4):366-373.
Shah PK, K 52. Out R, Hoekstra M, Spijkers JA, Kruijt JK, van Eck M, Bos IS, et al. Scavenger receptor class B type I is solely responsible for the selective uptake of cholesteryl esters from HDL by the liver and the adrenals in mice. J Lipid Res 2004;45:2088–2095.
Xu S, Laccotripe M, Huang X, Rigotti A, Zannis VI, Krieger M. Apolipoproteins of HDL can directly mediate binding to the scavenger receptor SR-BI, an HDL receptor that mediates selective lipid uptake. J Lipid Res 1997;38:1289–1298.
Asztalos BF, de la Llera-Moya M, Dallal GE, Horvath KV, Schaefer EJ, Rothblat GH. Differential effects of HDL subpopulations on cellular ABCA1- and SR-BI-mediated cholesterol efflux. J Lipid Res 2005;46:2246–2253.
Yancey PG, Kawashiri MA, Moore R, Glick JM, Williams DL, Connelly MA, et al. In vivo modulation of HDL phospholipid has opposing effects on SR-BI- and ABCA1-mediated cholesterol efflux. J Lipid Res 2004;45:337–346.
Fitzgerald ML, Okuhira K, Short GF 3rd, Manning JJ, Bell SA, Freeman MW. ATP-binding cassette transporter A1 contains a novel Cterminal VFVNFA motif that is required for its cholesterol efflux and apoA-I binding activities. J Biol Chem 2004;279:48477–48485.
Oram JF, Heinecke JW. ATP-binding cassette transporter A1: a cell cholesterol exporter that protects against cardiovascular disease. Physiol Rev 2005;85:1343–1372.
Acton S, Rigotti A, Landschulz KT, Xu S, Hobbs HH, Krieger M. Identification of scavenger receptor SR-BI as a high density lipoprotein receptor. Science 1996;271:518–520.
Out R, Hoekstra M, Spijkers JA, Kruijt JK, van Eck M, Bos IS, et al. Scavenger receptor class B type I is solely responsible for the selective uptake of cholesteryl esters from HDL by the liver and the adrenals in mice. J Lipid Res 2004;45:2088–2095.
Aoyama T, Morishita H, Takahashi M, Takatsu Y, Kawai C. Serum prostacyclin stabilizing factor is identical to apolipoprotein A-I (Apo AI). A novel function of Apo A-I. J Clin Invest 1988; 82(3): 803–7.
Dastani Z, Dangoisse C, Boucher B, Desbiens K, Krimbou L, Dufour R, Hegele RA, Pajukanta P, Engert JC, Genest J, Marcil M. A novel nonsense apolipoprotein A-I mutation (Apo A-I(E136X)) causes low HDL cholesterol in French Canadians. Atherosclerosis 2006;185(1):127–36.
Franceschini G, Sirtori M, Gianfranceschi G, Sirtori CR. Relation between the HDL apoproteins and AI isoproteins in subjects with the AIMilano abnormality. Metab Clin Exp 1981;30 (5): 502-9.
Zhu X, Wu G, Zeng W, Xue H, Chen B. Cysteine mutants of human apolipoprotein A-I: a study of secondary structural and functional properties. J Lipid Res 2005;46 (6):1303–11.
The idea that HDL cholesterol is cardioprotective is well accepted.
What is not as well appreciated is that, similar to the discordant relationship between the level of LDL‐C and number of low density lipoprotein particles in patients with residual CHD risk, the amount of cholesterol carried within high density lipoprotein particles may also vary significantly between individuals who have the same level of HDL‐C.1,2
For this reason, HDL‐C levels may not be a good indicator of the number of circulating HDL particles present and the amount of cardioprotection they confer.
CHD risk is impacted by the interaction of lipoproteins within the arterial wall. Low‐density lipoprotein particles promote atherosclerosis by penetrating the artery wall and subsequently becoming oxidized and ingested by macrophages. These macrophages become cholesterol‐rich foam cells that then deposit their lipid contents into the vessel wall and initiate development of atherosclerotic plaque.
HDL particles antagonize the atherosclerotic process by facilitating reverse cholesterol transport back to the liver, by inhibiting oxidation of LDL and blocking the deposition of lipids into the arterial wall, stimulating vasodilatation, inhibiting platelet aggregation and inhibiting endothelial cell apoptosis.
Therefore, the overall risk of CHD is greatly dependent upon the balance of these atherogenic and anti‐atherogenic processes.2,3
EPIC-Norfolk Study
Dr. Karim El Harchaoui and his colleagues performed a nested case‐control study of 822 apparently healthy men and women within the EPIC‐Norfolk cohort to determine the relationship of HDL particle size and number to risk of future CHD events. They observed that both HDL size and number were independently associated with other CHD risk factors and CHD risk.
Upon correction for metabolic syndrome markers, the HDL size was no longer associated with risk of future CHD events while the relationship of HDL particle number (HDL‐P) to CHD risk was not affected by adjustment for these same parameters. These data suggest that the association of HDL particle size is confounded by metabolic dysregulation, but that HDL‐P is an independent predictor of CHD even after correction for metabolic parameters.4
An earlier publication by Dr. James Otvos and his colleagues report data from a prospective, nested case‐control study of 364 men with a new CHD event to determine if low‐density lipoprotein particle number (LDL‐P) and HDL‐P provide additional information relative to CHD risk reduction at baseline and after 7 months of treatment with gemfibrozil or placebo.
On gemfibrozil treatment, HDL‐C increased by 6% while total HDL‐P increased by 10%. HDL‐C was not a significant predictor of CHD risk either at baseline or on–trial. HDL‐P was a strong, independent predictor of a new CHD event both at baseline and on‐trial. This relationship was preserved even after adjustment for LDL‐C, HDL‐C and triglycerides.5
How To Increase HDL-P
Until work is published containing management guidelines for HDL‐P, physicians are likely to be guided by the National Cholesterol Education Program – ATP III Guidelines that recommend treatment of low HDL‐C (< 40 mg/dL) after LDL‐C goals have been reached and triglycerides are < 200 mg/dL. Intensive weight management and increased physical activity are recommended as well as consideration of prescribing niacin or fibrates to increase HDL‐C.
Conclusion
Multiple studies support the relationship of HDL‐P to CHD outcomes and work continues to address the role HDL‐P plays at the molecular level and to measure the potential benefit of managing to HDL‐P targets. Since cardioprotection is a function of HDL particles themselves and is not a function of the cholesterol carried within them, it is possible that HDL‐P, may be a better indicator of cardioprotection than HDL‐C and may be a suitable target for CVD management.
References
Cromwell WC, Otvos JD, et al. LDL Particle number and risk of future cardiovascular disease in the Framingham Offspring Study – implications for LDL management. J Clin Lipidol 2007;1:583‐592.
Cromwell WC. High‐density lipoprotein associations with coronary heart disease: Does measurement of cholesterol content give the best result? J Clin Lipidol 2007;1:57‐64.
Assmann G, Nofer J. Atheroprotective effects of high‐density lipoproteins. Annu Rev Med 2003;54:321‐41.
El Harchaoui K, Arsenault BJ, Franssen R. High density lipoprotein particle size and concentration and coronary risk. Ann Intern Med 2009;15084‐93.
Otvos JD, Collins D, Freedman DS, et al. Low‐density lipoprotein and high‐density lipoprotein particle subclasses predict coronary events and are favorably changed by gemfibrozil therapy in the Veteran’s Affairs High‐Density Lipoprotein Intervention Trial. Circulation 2006;113:1556‐1563.
ATP III Guidelines At‐A‐Glance Quick Desk Reference. NHLBI. U.S. Department of Health and Human Services, NIH Publication No. 01‐330.
Cromwell WC, Dayspring T, Richman M. Lipid and Lipoprotein Disorders: Current Clinical Solutions. Pocket Guide. International Guidelines Center. 2009.
High density lipoproteins (HDLs) are found in human plasma in the density range 1.063-1.21 g/mL and consist by weight of approximately 50% protein, 25% phospholipid, 20% cholesterol, and 5% triglyceride.4,19 The cholesterol component of HDL has been inversely associated with the incidence of coronary heart disease.20-23 Total HDL levels in human plasma are approximately 250 mg/dL, and HDL has classically been divided into two density classes: HDL2 (d 1.063-1.125 g/mL), and HDL3 (d 1.125-1.21 g/mL).24
In reverse cholesterol transport, the liver first produces HDL as a globular protein that binds phospholipids and free cholesterol, assuming a flat, discoid shape, which is still cholesterol poor. The newly synthesized lipid-poor apolipoprotein A-I interacts with ABCA1, removing excess cellular cholesterol and forming pre-β–HDL. As pre-β – HDL circulates through the blood stream interacting with the enzyme lecithin cholesterol acyltransferase (LCAT) which is responsible for the esterification of cholesterol particles in pre-β–HDL-C, converting it to mature α-HDL (otherwise designated as HDL2 and HDL3). HDL3 is relatively cholesterol-poor. As cholesterol is accumulated from the circulation, it becomes engorged with cholesterol and gets transformed to a spherical HDL2 particle.
HDL2 is the largest and most cardio-protective of all the HDL subclasses. The fate of the lipids in HDL2, which are primarily cholesterol esters, involve multiple pathways:
Cholesteryl esters (CE) in HDL can be trafficked directly to steroidogenic tissues (adrenal glands, gonads) or adipocytes. Alternatively, the HDL can deliver its CE to the liver where it can be delipidated or endocytosed or to the small intestine where delipidation can also occur. The receptor that delipidates mature HDLs is the scavenger receptor B1 (SR-B1) and hepatic receptors capable of endocytosing HDLs are the holoparticle receptor (beta chain apoA-I synthase) or the LDL receptor which binds to apoE on HDLs. When HDLs traffic CE to the liver or intestine the process is called direct RCT.
CE in HDL can also be transferred by means of CETP to other HDL species or to VLDL or LDL in exchange for triglycerides (TG). Through this pathway, HDL-collected cholesterol from peripheral cells or the arterial wall is eventually transported to the liver via LDL and this process is termed indirect RCT.35 Total RCT is the sum of indirect and direct RCT. Because this is an ongoing, dynamic process in which HDLs are constantly being lipidated and delipidated, and exchanging core lipids, a serum HDL-C has no relationship to the process. Indeed, the last phase of RCT is delipidation of large HDLs.
TG-rich HDL particles may interact with the hepatic lipase enzyme, or hepatic endothelial cell lipase (HEL), which catabolizes some of the core lipids in HDL2, thereby converting the larger HDL2 to smaller HDL3, which are then returned to the circulation for relipidation.36 HDLs lipidate and delipidate multiple times over their six-day half-life.
HDL may have additional functions, unrelated to RCT, that play a role in its potential anti-atherogenic effect; these are most likely related to its proteome. HDL carries many proteins that perform a multitude of functions. Some HDL-associated proteins may decrease LDL oxidation and potentially have other antioxidant functions. HDLs also appear to stimulate the synthesis of leukocyte adhesion molecules in endothelial cells by supplying them with arachidonic acid.37 These unique functions are discussed in more detail in the later section on HDL2.
Clinical Interpretation
The cardioprotective effects of HDL are due in large part to reverse cholesterol transport. Several clinical studies support the association between CHD risk and HDL subclass levels. Cheung and colleagues demonstrated that coronary artery disease was more closely associated with HDL particle size than with actual HDL levels.2 Ballantyne et al. reported that in myocardial infarction survivors HDL2 but not HDL3 was decreased compared with control subjects.3
As the cholesterol content in HDL particles increases, these particles increase in size, forming larger, lipid- enriched, heterogeneous HDL particles. Human HDL’s separate into two major subfractions, which have been designated HDL2 (less dense) and HDL3 (more dense).16,17 The HDL subclasses differ in both structure and antiatherogenic properties. Because HDL2 particles reabsorb cholesterol more efficiently than other HDL subclasses, they are most closely associated with reverse cholesterol transport. HDL2 is also associated with paraoxanase, an antioxidant that inhibits the oxidation of LDL particles.1
The oxidative modification of low-density lipoprotein (LDL) is a key event in the initiation and acceleration of atherosclerosis.5,6 As an antiatherogenic mediator, HDL, aside from playing an important role in the reverse cholesterol transport, protects LDL against oxidation.6,8 The antioxidant property of HDL has been attributed in part to the HDL-bound enzyme paraoxonase-1 (PON1).9-11
Oxidatively modified LDL is a potent ligand for scavenger receptors on macrophages and contributes to the generation of macrophage-derived foam cells, the hallmark of early atherosclerotic fatty streak lesions.14,15 Studies have demonstrated that HDL2 suppresses LDL oxidation by interrupting the continuous chain of lipid peroxide (LOOH) oxidation and prevents the formation of the secondary oxidation products, such as malondialdehyde and 4-hydroynonenal, thereby suppressing the oxidation of apolipoprotein B of LDL particles.
It is known that the presence of anti-oxidative vitamins, such as ubiquinol, and anti-oxidative enzymes, paraoxinase,18-20 platelet-activating factor acetylhydrolase,21,22 and glutathione peroxidase,23 in HDL, suppresses the formation of lipid peroxides. It is possible that these substances or some other unknown substance interrupt lipid oxidation by breaking the chain oxidation reaction after LOOH formation, such that HDL2 can retard the further oxidation of partially oxidized LDL in a concentration-dependent manner.
Navab et al. reported that in the presence of systemic inflammation, antioxidant enzymes can be inactivated and HDL can accumulate oxidized lipid and proteins that make it pro-inflammatory.24 After native HDL2 inhibits further oxidative modification of partially oxidized LDL, native HDL2 becomes oxidized HDL2 and there is a possibility that oxidized HDL2 has a role in providing cholesterol to the liver and lymphocytes via LDL receptors.25,26
Treatment Considerations
HDL2 particle concentration may be increased by exercise, fish oil, or alcohol consumption in moderation. Niacin, fibric acids, and combination therapy (statin + niacin) have been demonstrated to increase large HDL particle concentration.
In a pooled analysis of four trials of statins, individuals with a ≥ 7.5% increase in serum HDL-C levels showed statistically significant regression of coronary atherosclerosis, independent of the serum LDL-C level.26 In a post- hoc analysis in the “Treating to New Targets” study27, the serum HDL-C levels were inversely related to the risk of cardiovascular events during statin treatment, even among patients with serum LDL-C levels < 70 mg/dL. Thus, changes in the serum HDL-C level appear to be a predictor of atherosclerotic cardiovascular risk, independent of the serum LDL-C level.
Aerobic exercise has been reported to elevate the serum HDL-C level by 5-10%, with the increase related to the frequency and intensity of exercise.28 The mechanism by which exercise increases the serum HDL-C level is not yet fully understood, but the effect has been attributed to an elevation in the levels of lipoprotein lipase.29 In general, the effect of statins in raising the serum HDL-C level is known to be modest (5-15%).30 All of the above- described research observations indicate that reasonable elevations of the serum HDL-C level may be obtained by the addition of aggressive lifestyle interventions to statin therapy. Despite the dramatic reductions in the cardiovascular risk with LDL-C lowering therapy, the residual cardiovascular risk remains significant.30
Therefore, intensive lifestyle interventions to raise the serum HDL-C level may serve as an additional strategy for addressing the residual cardiovascular risk in CAD patients with already elevated serum HDL-C and lowered serum LDL-C levels achieved with statin therapy. Evidently, the addition of intensive lifestyle modification to statin therapy for suppressing coronary plaque development not only has a synergistic effect in improving lipid metabolism, but also other antiarteriosclerotic effects.31
References
Graner M, James RW, Kahri J. Association of Paraoxonase-1 Activity and Concentration With Angiographic Severity and Extent of Coronary Artery Disease. J Am Coll Cardiol 2006;47:2429–35.
Cheung MC, Brown BG, Wolf AC, et al. Altered particle size distribution of apolipoprotein A-I-containing lipoproteins in subjects with coronary artery disease. J Lipid Res 1991;32:383-394.
Ballantyne FC, Clark RS, Simpson HS, et al. High density and low-density lipoprotein subfractions in survivors of myocardial infarction and in control subjects. Metabolism 1982;31(5):433-437.
Berglund L, Oliver EH, Fontanez N et al. HDL-subpopulation patterns in response to reductions in dietary total and saturated fat intakes in healthy subjects. Am J Clin Nutr 1999;70:992-1000.
Steinberg D, Parthasarathy S, Carew T, et al. Beyond cholesterol. Modifications of low-density lipoprotein that increases atherogenicity. N Engl J Med 1998;320:933–7.
Mackness MI, Abbott CA, Arrol S, et al. The role of high density lipoprotein and lipid soluble antioxidant vitamins in inhibiting low-density lipoprotein oxidation. Biochem J 1993;294:829–34.
Parthasarathy S, Barnett J, Fong LG. High-density lipoprotein inhibits the oxidative modification of low-density lipoprotein. Biochim Biophys Acta 1990;1044:275–83.
Mackness MI, Arrol S, Abbott CA, et al. Protection of low-density lipoprotein against oxidative modification by high-density lipoprotein associated paraoxonase. Atherosclerosis 1993;104:129 –35.
Watson AD, Berliner JA, Hama SY, et al. Protective effect of highdensity lipoprotein associated paraoxonase: inhibition of the biological activity of minimally oxidized low-density lipoprotein. J Clin Invest 1995;96:2882–91.
Aviram M, Rosenblat M, Bisgaier CL, et al. Paraoxonase inhibits high density lipoprotein (HDL) oxidation and preserves its functions: a possible peroxidative role for paraoxonase. J Clin Invest 1998;101:1581–90.
Miller GJ, Miller NE. Plasma high-density lipoprotein concentration and the development of ischaemic heart disease. Lancet 1975;1:16–9.
Gordon DJ, Rifkind BM. High-density lipoprotein—the clinical implications or recent studies. N Engl J Med 1989;321:1311–6.
Steinberg D, Parthasarathy S, Carew TE, Khoo JC, Witztum JL. Beyond cholesterol. Modifications of low-density lipoprotein that increase its atherogenicity. N Engl J Med 1989;320:915-924.
Schwartz CJ, Valente AJ, Sprague EA, et al. The pathogenesis of atherosclerosis: an overview. Clin Cardiol 1991;14:11-16.
Eisdenberg S. High density lipoprotein metabolism. J Lipid Res 1984;25:1017-1058.
Sakuma N, Lin C, Matsumoto Y, Ikeuchi R, et al. Changes of HDL subfraction concentration and particle size by intralipid in vivo. Atherosclerosis 1988;74:91-98.
Mackness MI, Arrol S, Abbott C, Durrington PN. Protection of low-density lipoprotein against oxidative modification by high-density lipoprotein associated paraxonase. Atherosclerosis 1993;104:129-135.
Kuremoto K, Watanabe Y, Ohmura H, et al. R/R genotype of human paraoxonase (PON1) is more protective against lipoprotein oxidation and coronary artery disease in Japanese subjects. J Atheroscler Thromb 2003;10:85-92.
Stafforni DM, Zimmerman GA, McIntyre TM, Prescott SM The plasma PAF acetylhydrolase prevents oxidative modification of low-density lipoprotein. J Lipid Mediat Cell Signal 1994;10:53-56.
Gardner AA, Reichert EC, Topham MK, Stafforni DM. Identification of a domain that mediates association of platelet-activating factor acetylhydrolase with high density lipoprotein. J Biol Chem 2008;283:17099-17106.\
Chen N, Liu Y, Greiner CD, Holtzman JL. Physiologic concentrations of homocysteine inhibit the human plasma GSH peroxidase that reduces organic hydroperoxides. J Lab Clin Med 2000;136:58-65.
Navab M, Anantharamaiah GM, Reddy ST, et al. Mechanisms of disease: pro-atherogenic HDL-an evolving field. Nat Clin Pract Endocrin Metab 2006;2:504-511.
Sakuma N, Saeki T, Ito T, et al. HDL2 can inhibit further oxidative modification of partially oxidized LDL. J Athero Thromb 2010;17:229-34.
Nicholls SJ, Tuzcu EM, Sipahi I, et al. Statins, high-density lipoprotein cholesterol, and regression of coronary atherosclerosis. JAMA 2007;297:499–508.
Barter P, Gotto AM, LaRosa JC, et al. For the Treating to New Targets Investigators. HDL cholesterol, very low levels of LDL cholesterol, and cardiovascular events. N Engl J Med 2007;357:1301-10.
King AC, Haskell WL, Young DR, et al. Longterm effects of varying intensities and formats of physical activity on participation rates, fitness, and lipoproteins in men and women aged 50 to 65 years. Circulation 1995;91:2596–2604.
Thompson PD. What do muscles have to do with lipoproteins? Circulation 1990;81:1428–30.
Baigent C, Keech A, Kearney PM, et al. Efficacy and safety of cholesterol-lowering treatment: Prospective meta-analysis of data from 90,056 participants in 14 randomised trials of statins. Lancet 2005;366:1267-78.
Roberts CK, Chen AK, Barnard RJ. Effect of a short-term diet and exercise intervention in youth on atherosclerotic risk factors. Atherosclerosis 2007;19:98-106.
Okada K, Maeda N, Tatsukawa M, et al. The influence of lifestyle modification on carotid artery intima-media thickness in a suburban Japanese population. Atherosclerosis 2004;173:329-37.
Okazaki S, Yokoyama T, Miyauchi K, et al. Early statin treatment in patients with acute coronary syndrome: Demonstration of the beneficial effect on atherosclerotic lesions by serial volumetric intravascular ultrasound analysis during half a year after coronary event: The ESTABLISH Study. Circulation 2004; 110:1061-8.
Tani S, Nagao K, Anazawa T, et al. Association of circulating leukocyte count with coronary atherosclerosis regression after pravastatin treatment. Atherosclerosis 2008;198:360–5.
Inazu A, Brown ML, Hesler CD, et al. Increased high density lipoprotein levels caused by common cholesteryl-ester transfer protein gene mutation. N Engl J Med 1990; 323:1234.
Navab M, Hama SY, Hough GP, et al. High density lipoprotein associated enzymes: Their role in vascular biology. Curr Opin Lipidol 1998;9: 449-456.
Pomerantz KB, Fleisher LN, Tall AR, Cannon PJ. Enrichment of endothelial cell arachidonate by lipid transfer from high density lipoproteins: Relationship to prostaglandin I2 synthesis. Lipid Res 1985;26:1267.
High-density lipoprotein (HDL) particles, characterized either in terms of cholesterol content or by the major protein constituent, apolipoprotein A-I (apoA-I), have been shown to be inversely related to risk of cardiovascular disease (CVD). In fact studies going back into the 1970s and even earlier indicate that the HDL particles are more strongly predictive of CVD risk than even the atherogenic LDL particles. Several mechanisms by which HDL provides cardioprotection have been proposed. One that is widely supported and accepted is reverse cholesterol transport (RCT), or more specifically macrophage RCT, whereby cholesterol is removed from sterol-laden arterial wall macrophages (foam cells). This mechanism helps the body clear excess cholesterol from the arterial wall. By RCT, excess cholesterol is collected in the periphery and transported back to the liver where it can be used for other processes or excreted to the biliary system as either free cholesterol or bile acids. Illustrated above is a schematic model of some of the complexities of cholesterol trafficking as mediated by HDLs. HDLs do not contain apolipoprotein B (apoB); rather, their main structural apoprotein is apoA-I. ApoA-I is synthesized by the liver and small intestine and released into the circulation as lipid-poor apoA-I. Through interaction with hepatic ATP-binding cassette transporter 1 (ABCA1), phospholipids and free cholesterol are transferred to the nascent apoA-1 and mobilized into the plasma compartment. The newly synthesized, lipid-poor apoA-I interacts with ABCA1, sequestering excess cellular cholesterol and forming pre-β–HDL. Although any cell can upregulate ABCA1 and lipidate immature HDL species, the vast majority of HDL lipidation occurs in the liver and the small intestine. HDL lipidation by the arterial wall macrophage is termed macrophage RCT and is thought to be a major mechanism by which HDLs can be cardioprotective. As pre-β–HDL circulates through the blood stream interacting with the enzyme lecithin: cholesterol acyltransferase (LCAT). LCAT is responsible for the esterification of free cholesterol particles on the pre-β–HDL surface, converting it cholesteryl ester, which migrates to the core of the particle, transforming the HDL into a small but maturing α-HDL4 and α-HDL3 (also called HDL3). Lipid-poor apoA-I may be incorporated directly into pre-existing, small spherical HDLs that consequently expand because of their interaction with LCAT. Additional free cholesterol is transferred to the maturing HDL particles through the ATP-binding cassette sub-family G member 1 (ABCG1) transporter, resulting in an even more mature, large HDL termed α-HDL2, and α-HDL1 (also called HDL2), the most maximally lipidated HDL. Therefore HDL2, which can be considered the product of RCT, includes the larger and cholesterol enriched particles, whereas HDL-3 contains relatively less cholesterol. HDL2 can thus be considered to represent the more cardioprotective of the HDL subclasses. The fate of the lipids in HDL2, which are primarily cholesterol esters, involve multiple pathways:
Cholesteryl esters (CE) in HDL can be trafficked directly to steroidogenic tissues (adrenal, gonads) or adipocytes. Alternatively the HDL can deliver its CE to the liver where it can be delipidated or endocytosed or to the small intestine where delipidation can also occur. The receptor that delipidates mature HDLs is the scavenger receptor B1 (SR-B1) and hepatic receptors capable of endocytosing HDLs are the holoparticle receptor (beta chain apoA-I synthase) or the LDL receptor which binds to apoE on HDLs. When HDLs traffic CE to the liver or intestine the process is called direct RCT.
CE in HDL can also be transferred by means of CETP to other HDL species, or to VLDL or LDL in exchange for triglycerides (TG). Through this pathway, HDL-collected cholesterol from peripheral cells or the arterial wall is eventually transported to the liver via LDL and this process is termed indirect RCT.1 Total RCT is the sum of indirect and direct RCT. Because this is an ongoing, dynamic process in which HDLs are constantly being lipidated and delipidated, and exchanging core lipids, a serum HDL-C has no relationship to the process. Indeed, the last phase of RCT is delipidation of large HDLs.
TG-rich HDL particles may interact with the hepatic lipase enzyme, or hepatic endothelial cell lipase (HEL), which catabolizes some of the core lipids in HDL2, thereby converting the larger HDL2 to smaller HDL3, which are then returned to the circulation for relipidation.4 HDLs lipidate and delipidate multiple times over their six day half-life.
HDL may have additional functions, unrelated to RCT, that play a role in its potential anti-atherogenic effect; these are likely related to its proteome. HDL carries many proteins that perform a multitude of functions. Some HDL-associated proteins may decrease LDL oxidation and potentially have other antioxidant functions. HDLs also appear to stimulate the synthesis of leukocyte adhesion molecules in endothelial cells by supplying them with arachidonic acid.6 These unique functions are discussed in more detail in the later section on HDL2.
Clinical Interpretation
Studies indicate that low HDL-C levels are relatively common in the general population, with reported rates of HDL-C < 40 mg/dL (to convert to mmol/L, multiply by 0.0259) of 16% to 18% in men and 3% to 6% in women. In addition, a low level of HDL-C is a component of the metabolic syndrome, which has a prevalence of 34% in US individuals older than 20 years.
Multiple epidemiologic studies have established a low level of HDL-C as an independent risk factor for CVD.7,10 For example, in the Framingham Heart Study, 43% to 44% of coronary events occurred in persons with HDL-C levels < 40 mg/dL (22% of the total study population).7 Individuals having HDL-C levels < 35 mg/dL, had an eightfold higher incidence of CVD compared with those having HDL-C levels of > 65 mg/dL.7,10 The strength of the relationship between low HDL-C levels and increased CVD risk also is significant in elderly individuals and may be greater in women than in men.7,10,11 Angiographic and ultrasonographic data indicate that low levels of HDL-C are associated with risk and severity of coronary artery disease, carotid disease, and postangioplasty restenosis. Observational studies have shown that each 1 mg/dL decrease in plasma HDL-C concentration is associated with a 2% to 3% increased risk of CVD. Data from observational trials reveals that each 1 mg/dL increase in plasma HDL-C is associated with a 6% lower risk of coronary death, independent of LDL-C level. 11,12 However, this hypothesis has not been proven in an empowered clinical trial looking at CV outcomes, and although guidelines encourage elevation of HDL-C using lifestyle and FDA approved therapies, there is no specific HDL-C goal of therapy. The 2008 ADA/ACC consensus statement on treatment of patients with cardiometabolic risk advises normalization of apoB as the effective way to reduce risk in those with low HDL-C.13
Treatment Considerations
Agents That Modify HDL Composition
Nicotinic Acid (Niacin)
First recognized as a treatment for dyslipidemia in 1955, nicotinic acid can increase HDL-C levels by 20% to 30% as well as reduce plasma triglyceride levels by 40% to 50% and LDL-C levels by up to 20%.15-27 When tolerated, nicotinic acid represents the most effective HDL-C–increasing agent currently available. The most compelling data to support the use of niacin are from the Coronary Drug Project (CDP), which evaluated niacin monotherapy in 8341 men with prior myocardial infarction. In this prestatin study, niacin was associated with a 27% reduction in the incidence of nonfatal reinfarction at six years,15 and all-cause mortality was reduced by 11% at 15 years.21
Other clinical outcomes studies of niacin have been conducted in the setting of combination therapy, with bile acid sequestrants or statins, and thus the results should be interpreted in this context. In general, treatment with niacin, both as monotherapy and in combination with other antidyslipidemic agents, has produced consistent clinical and atherosclerotic burden benefit. The CVD benefit of niacin is difficult to judge as the drug lowers apoB, raises HDL-C, ApoA-I, and HDL-P and can lower Lp(a) as well as having many pleiotropic effects. The therapeutic potential of niacin has been limited by its adverse effects (flushing and pruritus), which can be reduced by use of an extended release formulation. The American Diabetes Association has cautioned against the use of niacin by patients with diabetes, although recent niacin studies have shown no significant increase in long-term glycemic levels, use of oral hyperglycemic regimens, or niacin withdrawal in these patients. Uric acid must be monitored and caution is need in patients with a history of gout or uric acid calculi.32,33
Statins
Statins modestly increase HDL-C levels by 5% to 15%, and this effect is most evident with rosuvastatin and pitavastin.3,34 However in the recent JUPITER trial where rosuvastatin reduced adverse events there was no rise in HDL-C.35 In fact, there is no statin outcome trial showing that event reduction was statistically related to the statin’s effect on HDL-C. The mechanism for statin-induced increase in HDL-C levels is presently unclear, although via a peroxisome proliferator-activated receptor (PPAR)-alpha effect, statins can increase levels of apoA-I and lipid-poor HDL. Statins have also been shown to reduce CETP activity and may also augment the activity of the antioxidant enzyme paraoxonase.36-39 In a recent post hoc analysis of 1,455 patients with low HDL-
C levels, statins reduced coronary atheroma independent of LDL-C when HDL-C levels were increased by at least 7.5%.40 However, while statins may confer a greater reduction in CVD among patients with lower HDL-C levels, independent of LDL-C effects, this may simply be due to the fact that those patients tend to have the highest apoB and LDL-P levels.41
Agents That Target Reverse Cholesterol Transport and Macrophage Cholesterol Efflux
Fibrates
Fibrates (gemfibrozil, fenofibrate) and their active fibric acid derivatives (gemfibric or fenofibric acid) are agonists of PPARα. These compounds can increase HDL-C levels (by 10%-20%), modestly lower LDL-C levels (by 10%- 15%), and substantially lower levels of triglycerides (by 40%-50%).28,29 They increase apoA-I, apoA-II and both total and small HDL species (the species most capable of lipidation by ABCA1). They upregulate ABCA1 and thus enhance HDL lipidation, but also upregulate hepatic SR-B1 which helps delipidate mature HDLs (converting them to smaller species). They inhibit CETP activity.
Several studies have elucidated the effect of fibrates on reverse cholesterol transport. In the Helsinki Heart Study and the VA-HIT trial, treatment with gemfibrozil was associated with reduction in CVD events.28,29 The 22% reduction in coronary events in the VA-HIT trial was attributed to a modest increase (6%) in HDL-C levels.29 In contrast, the results of studies using other fibrates such as bezafibrate and fenofibrate have been negative with respect to the primary outcomes (but, like niacin, positive for secondary outcomes), while clofibrate has been associated with potential hazard.15,28,34,37-42 Some evidence indicates that the benefits seen in the VA-HIT cohort may be partly due to additional effects of fibrates on apolipoprotein synthesis and lipoprotein metabolism.43,44 The combination of fibrates, particularly gemfibrozil, with statins requires caution and monitoring of creatine kinase levels because of the risk for myotoxicity, including rhabdomyolysis.45 Because of this safety concern and variable-outcome study results, the precise role of fibrate treatment remains uncertain but likely includes some patients at high risk of coronary artery disease, low levels of HDL-C, and increased levels of serum triglycerides.
Appropriate strategies to increase HDL-C levels (the majority of whom are insulin resistant, with high apoB and LDL-P levels) include aggressive overall lifestyle modification (exercise, diet, weight loss, and smoking cessation). Patients at increased risk for CHD with low HDL-C levels should be started on statins to get apoB and LDL-P to goal. Niacin and fenofibrate or fenofibric acid (if TG are > 200 mg/dL) therapy also merit consideration in combination with statin therapy in patients at high risk for CHD. Neither niacin nor a fibrate should be used as monotherapy in patients who are able to take a statin.
References
Inazu A, Brown ML, Hesler CD, et al. Increased high density lipoprotein levels caused by common cholesteryl-ester transfer protein gene mutation. N Engl J Med 1990; 323:1234.
Williams DL, Connelly MA, Temel RE, et al. Scavenger receptor BI and cholesterol trafficking. Curr Opin Lipidol 1999;10:329-339.
Acton S, Rigotti A, Landschulz KT, et al. Identification of scavenger receptor SR-BI as a high density lipoprotein receptor. Science 1996;271:518-520.
Navab M, Hama SY, Hough GP, et al. High density lipoprotein associated enzymes: Their role in vascular biology. Curr Opin Lipidol 1998;9: 449-456.
Anderson DW, Nichols AV, Pan SS, et al. High density lipoprotein distribution. Resolution and determination of three major components in a normal population. Atherosclerosis 1978;29:161-179.
Pomerantz KB, Fleisher LN, Tall AR, et al. Enrichment of endothelial cell arachidonate by lipid transfer from high density lipoproteins: Relationship to prostaglandin I2 synthesis. Lipid Res 1985;26:1267.
Castelli WP, Garrison RJ, Wilson PW, et al. Incidence of coronary heart disease and lipoprotein cholesterol levels: the Framingham Study. JAMA 1986;256(20):2835-2838.
Ford ES, Giles WH, Dietz WH. Prevalence of the metabolic syndrome among US adults: findings from the third National Health and Nutrition Examination Survey. JAMA 2002;287(3):356-359.
Grundy SM, Cleeman JI, Daniels SR, et al. Diagnosis and management of the metabolic syndrome: an American Heart Association/National Heart, Lung, and Blood Institute Scientific Statement. Circulation 2005;112(17):2735-2752.
Sharrett AR, Ballantyne CM, Coady SA, et al. Coronary heart disease prediction from lipoprotein cholesterol levels, triglycerides, lipoprotein(a), apolipoproteins A-I and B, and HDL density subfractions: the Atherosclerosis Risk in Communities (ARIC) Study. Circulation 2001;104(10):1108-1113.
Chapman MJ, Assmann G, Fruchart JC, et al. Raising high-density lipoprotein cholesterol with reduction of cardiovascular risk: the role of nicotinic acid—a position paper developed by the European Consensus Panel on HDL-C. Curr Med Res Opin 2004;20(8):1253-1268.
Gordon DJ, Rifkind BM. High-density lipoprotein— the clinical implications of recent studies. N Engl J Med 1989;321(19):1311-1316.
Brunzell JD, Davidson M, Furberg C, et al. Lipoprotein management in patients with cardiometabolic risk. Consensus statement from the American Diabetes Association and the American College of Cardiology Foundation. Diabetes Care 2008;31:811–22.
Assmann G, Gotto AM Jr. HDL cholesterol and protective factors in atherosclerosis. Circulation 2004;109(23)(suppl 1):iii8-III14.
Clofibrate and niacin in coronary heart disease. JAMA 1975;231(4):360-381.
Blankenhorn DH, Azen SP, Crawford DW, et al. Effects of colestipol-niacin therapy on human femoral atherosclerosis. Circulation 1991;83(2):438-447.
Blankenhorn DH, Nessim SA, Johnson RL, Sanmarco ME, Azen SP, Cashin-Hemphill L. Beneficial effects of combined colestipol-niacin therapy on coronary atherosclerosis and coronary venous bypass grafts. JAMA 1987;257(23):3233-3240.
Blankenhorn DH, Selzer RH, Crawford DW, et al. Beneficial effects of colestipol-niacin therapy on the common carotid artery: two- and four-year reduction of intima-media thickness measured by ultrasound. Circulation 1993;88(1):20-28.
Brown BG, Zhao XQ, Chait A, et al. Simvastatin and niacin, antioxidant vitamins, or the combination for the prevention of coronary disease. N Engl J Med 2001;345(22):1583-1592.
Brown G, Albers JJ, Fisher LD, et al. Regression of coronary artery disease as a result of intensive lipid lowering therapy in men with high levels of apolipoprotein B. N Engl J Med 1990;323(19):1289-1298.
Canner PL, Berge KG, Wenger NK, et al. Fifteen year mortality in Coronary Drug Project patients: longterm benefit with niacin. J Am Coll Cardiol 1986;8(6):1245-1255.
Carlson LA, Rosenhamer G. Reduction of mortality in the Stockholm Ischaemic Heart Disease Secondary Prevention Study by combined treatment with clofibrate and nicotinic acid. Acta Med Scand 1988;223(5):405-418.
Cashin-Hemphill L, Mack WJ, Pogoda JM, et al. Beneficial effects of colestipol-niacin on coronary atherosclerosis: a 4-year follow-up. JAMA 1990;264(23):3013-3017.
Haskell WL, Alderman EL, Fair JM, et al. Effects of intensive multiple risk factor reduction on coronary atherosclerosis and clinical cardiac events in men and women with coronary artery disease: the Stanford Coronary Risk Intervention Project (SCRIP). Circulation 1994;89(3):975-990.
Taylor AJ, Lee HJ, Sullenberger LE. The effect of 24 months of combination statin and extendedrelease niacin on carotid intima-media thickness: ARBITER 3. Curr Med Res Opin 2006;22(11):2243-2250.
Taylor AJ, Sullenberger LE, Lee HJ, Lee JK, Grace KA. Arterial Biology for the Investigation of the Treatment Effects of Reducing Cholesterol (ARBITER) 2: a double-blind, placebo-controlled study of extended release niacin on atherosclerosis progression in secondary prevention patients treated with statins. Circulation 2004;110(23):3512-3517.
Whitney EJ, Krasuski RA, Personius BE, et al. A randomized trial of a strategy for increasing highdensity lipoprotein cholesterol levels: effects on progression of coronary heart disease and clinical events. Ann Intern Med 2005;142(2):95-104.
Frick MH, Elo O, Haapa K, et al. Helsinki Heart Study: primary-prevention trial with gemfibrozil in middle-aged men with dyslipidemia: safety of treatment, changes in risk factors, and incidence of coronary heart disease. N Engl J Med 1987;317(20): 1237-1245.
Rubins HB, Robins SJ, Collins D, et al. Veterans Affairs High-Density Lipoprotein Cholesterol Intervention Trial Study Group. Gemfibrozil for the secondary prevention of coronary heart disease in men with low levels of high-density lipoprotein cholesterol. N Engl J Med 1999;341(6):410-418.
Trial of clofibrate in the treatment of ischaemic heart disease: five-year study by a group of physicians of the Newcastle upon Tyne region. Br Med J 1971;4(5790):767-775.
Ischaemic heart disease: a secondary prevention trial using clofibrate: report by a research committee of the Scottish Society of Physicians. Br Med J 1971; 4(5790):775-784.
Elam MB, Hunninghake DB, Davis KB, et al. Effect of niacin on lipid and lipoprotein levels and glycemic control in patients with diabetes and peripheral arterial disease: the ADMIT study: a randomized trial. JAMA 2000;284(10):1263-1270.
Grundy SM, Vega GL, McGovern ME, et al. Efficacy, safety, and tolerability of once-daily niacin for the treatment of dyslipidemia associated with type 2 diabetes: results of the assessment of diabetes control and evaluation of the efficacy of Niaspan trial. Arch Intern Med 2002;162(14):1568-1576.
Jones PH, Davidson MH, Stein EA, et al. Comparison of the efficacy and safety of rosuvastatin versus atorvastatin, simvastatin, and pravastatin across doses (STELLAR* Trial). Am J Cardiol 2003;92(2): 152-160.
Ridker PM, Genest J, Boekholdt SM, et al. HDL cholesterol and residual risk of first cardiovascular events after treatment with potent statin therapy: an analysis from the JUPITER trial. Lancet 2010;376(9738):333-9.
Asztalos BF, Horvath KV, McNamara JR, et al. Comparing the effects of five different statins on the HDL subpopulation profiles of coronary heart disease patients. Atherosclerosis 2002;164(2):361-369.
Deakin S, Leviev I, Guernier S, et al. Simvastatin modulates expression of the PON1 gene and increases serum paraoxonase: a role for sterol regulatory element-binding protein-2. Arterioscler Thromb Vasc Biol 2003;23(11):2083-2089.
Klerkx AH, de Grooth GJ, Zwinderman AH, et al. Cholesteryl ester transfer protein concentration is associated with progression of atherosclerosis and response to pravastatin in men with coronary artery disease (REGRESS). Eur J Clin Invest 2004;34(1):21-28.
Martin G, Duez H, Blanquart C, et al. Statin-induced inhibition of the Rho-signaling pathway activates PPARalpha and induces HDL Apo A-I. J Clin Invest 2001;107(11):1423-1432.
Nicholls SJ, Tuzcu EM, Sipahi I, et al. Statins, high density lipoprotein cholesterol, and regression of coronary atherosclerosis. JAMA 2007;297(5):499-508.
Heart Protection Study Collaborative Group. MRC/BHF Heart Protection Study of cholesterol lowering with simvastatin in 20,536 high-risk individuals: a randomized placebo-controlled trial. Lancet 2002;360(9326):7-22.
Ansell BJ. Rationale for combination therapy with statin drugs in the treatment of dyslipidemia. Curr Atheroscler Rep 2005;7(1):29-33.
Després JP, Lemieux I, Robins SJ. Role of fibric acid derivatives in the management of risk factors for coronary heart disease. Drugs 2004;64(19):2177-2198.
Császár A. Hypertriglyceridemia, the coronary heart disease risk marker ‘solved. Acta Physiol Hung 2005; 92(2):109-120.
National Cholesterol Education Program (NCEP) Expert Panel on Detection, Evaluation, and Treatment of High Blood Cholesterol in Adults (Adult Treatment Panel III). Executive Summary of The Third Report of the National Cholesterol Education Program (NCEP) Expert Panel on Detection, Evaluation, and Treatment of High Blood Cholesterol in Adults (Adult Treatment Panel III). JAMA 2001;285(19):2486-2497.
Singh, IM, Mehdi H. Shishehbor, MH, et al. High-density lipoprotein as a therapeutic target: A systematic review. JAMA 2007;298(7):786-798.
Homocysteine (Hcy) is a sulfhydryl-containing amino acid produced by intracellular demethylation of the essential amino acid methionine (Met). It is not used to make proteins but as an intermediate in methionine metabolism.
What does homocysteine do?
Serum Homocysteine isoforms are reduced to free Homocysteine, and then exogenous S-adenosylmethionine (SAM) methylates Homocysteine to form SAH and Met, a reaction catalyzed by Homocysteine methyltransferase. SAH is then hydrolyzed to Homocysteine and adenosine (ADO) by SAH hydrolase. ADO is immediately hydrolyzed into inosine and ammonia, which reacts with glutamate dehydrogenase with concomitant conversions of NADH to NAD+ measured at ΔA340nm.
Homocysteine continuously cycles through this reaction to significantly amplify the detection signal. B vitamins are important cofactors in this metabolic pathway. When methionine levels are low, methyltetrahydrofolate (from folic acid) donates methyl groups to generate methionine from Homocysteine, and vitamin B12 is also necessary for the methionine synthase-catalyzed remethylation of homocysteine into methionine. When there is excess methionine, the biologically active form of vitamin B6 catalyzes homocysteine transulfuration to cystathionine and ultimately to cysteine (excess of which is eliminated by the body).
Homocysteine and Cardiovascular Disease
Homocysteine mediates adverse effects on the blood vessels through diverse pathways:
homocysteine isoforms directly damage the blood vessel walls11
interactions between homocysteine and low-density lipoprotein (LDL) cholesterol contribute to subendothelial plaque genesis3
post-translational modifications of LDL particles, promoting the formation of foam cells and plaque progression12
increased peroxide production and reduced glutathione peroxidase activity increase endothelial cell damage13
reduced nitric oxide availability results in vasoconstriction11
activation of monocytes leads to cytokine secretion and inflammation3,14
platelet activation and aggregation, reduced thrombomodulin expression, depressed protein-C activity, and tissue plasminogen activator cause dysregulation of the coagulation system.3,15,16
Hyperhomocysteinemia is also associated with impaired hepatic capacity to synthesize apoA-I, thereby lowering HDL particle concentrations.17
Although the association between Hcy and vascular disease is widely recognized, elevated Hcy has also been associated with the following disorders and diseases:
Deficiency of folic acid or vitamins B6/B12: Elevated homocysteine levels are most commonly caused by low levels of one or all of these B vitamins. A normal homocysteine excludes significant B vitamin deficiency.15,18
Liver disease: Elevated Hcy and low levels of SAM are associated with liver toxicity and cirrhosis.19,20 Homocysteine may cause liver damage, leading to the formation of fibrin, clots, and vascular complications.21
Renal disease: homocysteine levels rise during renal insufficiency due to inadequate homocysteine filtration.22,23
Thyroid conditions: Elevated homocysteine levels may contribute to accelerated heart disease in patients with concomitant hypothyroidism.24
Alzheimer’s disease and dementia: Elevated homocysteine levels have been associated with Alzheimer’s disease incidence, indicating impaired methylation in brain tissue.25,26,27
Depression: Low serum folic acid levels have been associated with depression in women.28,29 Of interest, low levels of serum folate reduce the efficacy of fluoxetine (Prozac®, an antidepressant),28 while Vitamin B6may alleviate depression.30
Erectile dysfunction: A case study described a patient with erectile dysfunction who had a genetic defect causing elevated serum homocysteine levels. Although the patient did not initially respond to treatment with sildenafil (Viagra®), subsequent supplementation with 5 mg of folic acid and 1 mg of vitamin B12 resulted in successful treatment of his erectile dysfunction with sildenafil.31 Homocysteine has been shown to reduce production of nitric oxide, a vasodilator that increases blood flow to organs such as the penis.32
Ocular disease: homocysteine’s ability to damage blood vessels extends to the ocular microvasculature. Elevated homocysteine levels are associated with ocular diseases such as glaucoma and macular degeneration. Mean homocysteine levels in patients with central retinal vein occlusion were 11.6 μmol/L compared with 9.5 μmol/L in control subjects.33
Additional risk factors for elevated homocysteine levels include advanced age (often due to vitamin B12 deficiency owing to increased malabsorption with age), male sex, genetic defects of homocysteine metabolizing enzymes, diabetes mellitus, smoking, coffee intake, hyperproliferative conditions (e.g. psoriasis, rheumatoid arthritis), malignancies and drugs that affect homocysteine metabolism (e.g., some lipid-modifying drugs, anticonvulsants, folate and B12 antagonists, metformin).6,18,34,35
Should we lower Homocysteine?
The many links between elevated plasma homocysteine and diseases that afflict the elderly point to the existence of a common denominator that may be responsible for these diseases. Whether this denominator is homocysteine itself or whether homocysteine is merely a biomarker remains to be determined.
Since multiple clinical trials have demonstrated no cardiovascular event reductions despite lowering homocysteine using folic acid and B vitamin supplementation, the benefit of homocysteine-lowering strategies has been debated.4,6,15,34,36,37
However, the development of an atherosclerotic plaque takes a long time, typically 30-40 years from initial development to a clinical event. If homocysteine were a true causal contributor to this process, the time required to show a beneficial intervention effect of lowering homocysteine could take much longer than the < 5 years of follow-up characterizing the B-vitamin intervention trials.15
Thus it is possible that the homocysteine-lowering trials, although studying large numbers of patients, have been underpowered simply because the duration of follow-up has been too short in relation to the development time-frame for atherosclerotic disease.15,36 In support of this notion, a meta-analysis of the effect of B vitamins on stroke showed a full absence of any effect in short term studies (< 36 months) but a statistically significant 29% reduction in the studies with at least 36 months of follow-up.38
A large meta-analysis of more than 90 genetic and prospective studies calculated that lowering homocysteine levels by 3 µmol/L (by increased folic acid intake) would reduce the risk of ischemic heart disease by 16%, DVT by 25% and stroke by 25%.8 Lowering homocysteine levels may also increase nitrous oxide availability and reduce endothelial dysfunction.15,37 But the debate over whether plasma homocysteine can be considered a modifiable risk factor for atherosclerosis still rages.15,36
In particular, it is still unclear whether endogenous variations of plasma homocysteine within normal range are accompanied by clinically significant variations in endothelial dysfunction, oxidative stress, or the overall thrombotic state.15
Beneficial Dietary Modifications
Ingestion of Met may increase homocysteine levels since homocysteine is a Met metabolite. Indeed, homocysteine levels have been increased in experimental protocols through Met supplement ingestion.39 Foods rich in Met such as meat and eggs have been associated with increased risk of heart disease, although causality between Met content and CVD has not been established.
Diets high in fruits and vegetables that contain folic acid, beta-carotene, and vitamin C lowered homocysteine levels: in one study, healthy people consumed diets containing either one pound of fruits and vegetables or 3½ ounces of fruits and vegetables daily; homocysteine levels were 11% lower in the former group as compared with the latter after four weeks.40
Also of interest, replacing a breakfast of refined rice with whole-grain and legume powder significantly lowered homocysteine levels in men with cardiovascular disease (CVD).41 People with elevated homocysteine are typically advised to eat less processed foods, meat, and saturated fat to lower the risk of heart disease.
Beneficial Lifestyle Modifications
Cigarette smoking and coffee consumption are associated with increased homocysteine levels,42 an observation consistent with the association between smoking and caffeine consumption and increased risk of both CVD and osteoporosis. The correlation between coffee intake and increased homocysteine has been confirmed in some,43 but not all, studies.44 T
o exemplify the effects of lifestyle modification on homocysteine levels, a diverse group of people participated in a weeklong program that included a strict vegan diet, stress management, spirituality enhancement sessions, group support, and exclusion of tobacco, alcohol, and caffeine.45 B vitamin supplements known to reduce plasma homocysteine levels were not provided. Mean homocysteine levels declined by 13% after one week of lifestyle modification.
Thus a whole diet approach high in fruit and vegetables with high natural folate content is recommended to decrease plasma homocysteine levels, with the added benefit of increasing the intake of other important nutrients as well.
Beneficial Supplementations
Vitamins B6, B12, and folic acid are essential cofactors in homocysteine metabolism to Met and cysteine, and therefore supplementation has consistently lowered plasma homocysteine.3,6,15,18,37 Oral administration of folic acid (0.5-5 mg/day) reduces fasting homocysteine levels by 25-30%, while supplementation with vitamin B12 (0.02-1 mg/day) yields an additional 7% reduction in homocysteine levels.46
Folic acid supplementation lowers homocysteine levels most significantly in healthy individuals.47,48 However, a decrease of serum homocysteine of 3 µmol/L is achievable by daily intake of ~0.8 mg folic acid and should reduce risk of ischemic heart disease by 16%, DVT by 25% and stroke by 24%.8
In 1996, the FDA required that all enriched flour, rice, pasta, cornmeal, and other grain products contain 140 µg of folic acid per 3.5 ounces.49 This level of fortification has led to a measurable decrease in serum homocysteine levels.50
However, higher levels of folic acid fortification result in further homocysteine reductions, suggesting that the FDA-mandated supplementation is inadequate to optimally protect people against hyperhomocysteinemia. Therefore, if one wishes to optimally reduce homocysteine levels, despite the current lack of level I evidence supporting CV risk reduction,36,37 folic acid supplements should complement the FDA-mandated fortification program.
Vitamin B2 (riboflavin) supplementation (1.6 mg per day) lowered homocysteine levels by 22-40% in individuals with a genetic variant of an enzyme involved in folic acid metabolism (the 677C>T polymorphism of the methylenetetrahydrofolate reductase (MTHFR) gene.51 Approximately 10% of the population are homozygous for this genetic variant and could benefit from riboflavin supplementation.52,53
An alternative therapy is supplementation with methylated folic acid, the active form of folate. Specific methyl donors such as TMG/ betaine (1.5-6 g per day; 1.5 g usual standard diets) and choline (2 g per day or 2.6 g daily provided as 34 g of soy lecithin) may also lower homocysteine supplements, are other potential aids to the conversion of homocysteine to methionine (simultaneously lowering serum homocysteine). Doctors have traditionally considered supplementation with these nutrients only when vitamin B6, vitamin B12, and folate supplementation fail to reduce homocysteine to optimal levels, but they can be key methyl donors in the presence of MTHFR mutations which impair methylation ability.52
Despite the beneficial health effects of supplementation with B vitamins, it is important to note that there are possible dual effects on atherosclerosis, with the intrinsic beneficial effects of homocysteine-lowering being offset by detrimental effects of unmetabolized synthetic folic acid and/or stimulation of inflammation (and possibly proliferation) in existing atherosclerotic lesions by B vitamins.15,36 These factors may partly explain why clinical trials on homocysteine lowering failed to report improvement in CV risk and clinical outcome, and are currently under intense investigation. Following current recommendations, the target plasma homocysteine level is ≤ 10 µmol/L.15,18,34,36,57
In patients with CVD or high-risk for CVD events, a high homocysteine level may be used as a prognostic factor for CVD events and mortality:
Mild to moderate hyperhomocysteinemia indicates high risk for CVD and usually stems from poor diet, mild folate/B12/B6 deficiency, hypothyroidism, impaired renal function, or certain drugs.15,18,34,57When the cause of moderate hyperhomocysteinemia is established, then the best treatment is reversal of thiscause.
Increased tHcy combined with low B vitamin levels indicates a potential vitamin deficiency: supplement with a multivitamin containing moderate amounts of folic acid (0.2-0.8 mg), B6 (2-25 mg) and B12 (3-100 µg/day).18
Switch to high-dose B vitamins only if homocysteine clearly remains elevated and there is no MTHFR mutation (in which case riboflavin or supplementary methyl donors such as 5-MTHF or betaine may lower tHcy).
Intermediate hyperhomocysteinemia (fasting plasma tHcy 30-100 µmol/L) is usually the result of moderate/severe vitamin B12 or folate deficiency, homozygous enzyme defects in homocysteine metabolism, or renal failure.34,57 Again, diagnosis and reversal of the respective cause should be the main priority, while most patients respond well to folate alone or in combination with B12, B6 and possibly betaine. Use of all 4 supplements reduces homocysteine in people with renal failure. Notably, high doses of vitamin B12 are required for normalization of homocysteine levels after renal failure.23
Severe vitamin B12 deficiency and homocystinuria are the main causes of severe hyperhomocysteinemia (fasting plasma tHcy >100 µmol/L) and should be treated accordingly (0.02-1 mg/day of B12, 5-25 mg/day of B6 and 1-5 mg/day of folic acid),18 since it is associated with an increased pro-thrombotic state.
Long-term treatment with high doses of folic acid may mask pernicious anemia caused by vitamin B12 deficiency. The high folate may correct the anemia but allow the neuropathy to progress undiagnosed, leading eventually to irreversible degeneration of the spinal cord. It is therefore important to measure B12 levels before the start of folate treatment and/or treat with folate and B12 together.
References
Malinow MR, Nieto FJ, Szklo M, et al. Carotid artery intimal-medial wall thickening and plasma homocyst(e)ine in asymptomatic adults. The Atherosclerosis Risk in Communities Study. Circulation 1993; 87(4):1107-13.
McCully KS. Homocysteine, folate, vitamin B6, and cardiovascular disease. JAMA 1998; 279(5):392-3.
Manolescu BN, Oprea E, Farcasanu IC, et al. Homocysteine and vitamin therapy in stroke prevention and treatment: a review. Acta Biochimica Polonica2010;57(4):467-477.
Selhub J. The many facets of hyperhomocysteinemia: studies from the Framingham cohorts. J Nutr2006;136:1726S-1730S.
Christen WG, Ajani UA, Glynn RJ, Hennekens CH. Blood levels of homocysteine and increased risks of cardiovascular disease: causal or casual? Arch Intern Med2000;160:422-434.
Wierzbucki, AS. Homocysteine and cardiovascular disease: a review of the evidence. Diab Vasc Dis Res2007;4:143-50.Garlick PJ. Toxicity of methionine in humans. J Nutr2006;136:1722S-1725S
Broekmans WM, Klopping-Ketelaars IA, Schuurman CR, et al. Fruits and vegetables increase plasma carotenoids and vitamins and decrease homocysteine in humans. J Nutr2000;130:1578–83.
Jang Y, Lee JH, Kim OY, et al. Consumption of whole grain and legume powder reduces insulin demand, lipid peroxidation, and plasma homocysteine concentrations in patients with coronary artery disease: randomized controlled clinical trial. Arterioscler Thromb Vasc Biol2001;21:2065–71.
Nygård O, Refsum H, Ueland PM, Vollset SE. Major lifestyle determinants of plasma total homocysteine distribution: the Hordaland Homocysteine Study. Am J Clin Nutr1998;67:263–70.
Stolzenberg-Solomon RZ, Miller ER 3rd, Maguire MG, et al. Association of dietary protein intake and coffee consumption with serum homocysteine concentrations in an older population. Am J Clin Nutr1999;69:467–75.
Stanger O, Weger M. Interactions of homocysteine, nitric oxide, folate and radicals in the progressively damaged endothelium. Clin Chem Lab Med 2003;41(11):1444-1454.
Thomson MJ, Puntmann V, Kaski JC. Atherosclerosis and oxidant stress: the end of the road for antioxidant vitamin treatment? Cardiovasc Drugs Ther 2007;21:195-210.
Weiss N, Heydrick SJ, Postea O, et al. Influence of hyperhomocysteinemia on the cellular redox state – impact of homocysteine-induced endothelial dysfunction. Clin Chem Lab Med 2003;41(11):1455-1461.
El Oudi M, Aouni Z, Mazigh C, et al. Homocysteine and markers of inflammation in acute coronary syndrome. Exp Clin Cardiol 2010;15:e25-e28.
Antoniades C, Antonopoulos AS, Tousoulis D, et al. Homocysteine and coronary atherosclerosis: from folate fortification to the recent clinical trials. European Heart J 2009;30:6-15.
Lentz SR. Mechanisms of homocysteine-induced atherothrombosis. J Thromb Haemost 2005;3:1646-54.
Liao, D, Tan, H, Hui, R, et al. Hyperhomocysteinemia decreases circulating high-density lipoprotein by inhibiting apolipopotein A-1 protein synthesis and enhancing HDL cholesterol clearance. Circ Res 2006; 99:598-606.
Stanger O, Herrmann W, Pietrzik K, et al. Clinical use and rational management of homocysteine, folic acid, and B vitamins in cardiovascular and thrombotic diseases. Z Kardiol 2004;93:439-453
Martínez-Chantar ML, García-Trevijano ER, Latasa MU, et al. Importance of a deficiency in S-adenosyl-L-methionine synthesis in the pathogenesis of liver injury. Am J Clin Nutr 2002;76(5):1177S-82S.
Ventura P, Rosa MC, Abbati G, et al. Hyperhomocysteinaemia in chronic liver diseases: role of disease stage, vitamin status and methylenetetrahydrofolate reductase genetics. Liver Int 2005;25(1):49-56.
de la Vega MJ, Santolaria F, González-Reimers E, et al. High prevalence of hyperhomocysteinemia in chronic alcoholism: the importance of the thermolabile form of the enzyme methylenetetrahydrofolate reductase (MTHFR). Alcohol 2001;25(2): 59-67.
Friedman AN, Bostom AG, Selhub J, et al. The kidney and homocysteine metabolism. J Am Soc Nephrol 2001;12(10):2181-9.
Righetti M, Tommasi A, Lagona C, et al. Effective homocysteine-lowering vitamin B treatment in peritoneal dialysis patients. Perit Dial Int 2004;24(4):373-7.
Morris MS, Bostom AG, Jacques PF, et al. Hyperhomocysteinemia and hypercholesterolemia associated with hypothyroidism in the third US National Health and Nutrition Examination Survey. Atherosclerosis 2001;155(1):195-200.
McCaddon A, Davies G, Hudson P, et al. Total serum homocysteine in senile dementia of Alzheimer type. Int J Geriatr Psychiatry 1998;13(4):235-9.
Werder SF. Cobalamin deficiency, hyperhomocysteinemia, and dementia. Neuropsychiatr Dis Treat 2010;6:159-95.
Hermann W, Obeid R. Homocysteine: a biomarker in neurodegenerative diseases. Clin Chem Lab Med 2011;49(3):435-441.
Fava M, Borus JS, Alpert JE, et al. Folate, vitamin B12, and homocysteine in major depressive disorder. Am J Psychiatry 1997;154(3):426-8.
Beydoun MA, Shroff MR, Beydoun HA, Zonderman AB. Serum folate, vitamin B-12, and homocysteine and their association with depressive symptoms among U.S. adults. Psychosom Med 2010;72(9):862-73.
Hvas AM, Juul S, Bech P, et al. Vitamin B6 level is associated with symptoms of depression. Psychother Psychosom 2004;73(6):340-3.
Lombardo F, Sgrò P, Gandini L, Dondero F, Jannini EA, Lenzi A. Might erectile dysfunction be due to the thermolabile variant of methylenetetrahydrofolate reductase? J Endocrinol Invest 2004;27(9):883-5.
Demir T, Comlekçi A, Demir O, et al. Hyperhomocysteinemia: a novel risk factor for erectile dysfunction. Metabolism 2006;55(12):1564-8
Vine AK. Hyperhomocysteinemia: a new risk factor for central retinal vein occlusion. Trans Am Ophthalmol Soc 2000;98:493-503.
Refsum H, Smith AD, Ueland PM, et al. Facts and recommendations about total homocysteine determinations: an expert opinión. Clin Chem 2004;50:3-32.
Yaman H, Akgul EO, Kurt YG, et al. Plasma total homocysteine concentrations in a Turkish population sample. Acta Cardiol 2009;64(2):247-51.
Clarke R, Halsey J, Lewington S, et al. B-Vitamin Treatment Trialists’ Collaboration. Effects of lowering homocysteine levels with B vitamins on cardiovascular disease, cancer, and cause-specific mortality: Meta-analysis of 8 randomized trials involving 37 485 individuals. Arch Intern Med 2010;170(18):1622-31.
Wang X, Qin X, Demirtas H, Li J, et al. Efficacy of folic acid supplementation in stroke prevention: a meta-analysis. Lancet 2007;369:1876-1882.
Garlick PJ. Toxicity of methionine in humans. J Nutr 2006;136:1722S-1725S
Broekmans WM, Klopping-Ketelaars IA, Schuurman CR, et al. Fruits and vegetables increase plasma carotenoids and vitamins and decrease homocysteine in humans. J Nutr 2000;130:1578–83.
Jang Y, Lee JH, Kim OY, et al. Consumption of whole grain and legume powder reduces insulin demand, lipid peroxidation, and plasma homocysteine concentrations in patients with coronary artery disease: randomized controlled clinical trial. Arterioscler Thromb Vasc Biol 2001;21:2065–71.
Nygård O, Refsum H, Ueland PM, Vollset SE. Major lifestyle determinants of plasma total homocysteine distribution: the Hordaland Homocysteine Study. Am J Clin Nutr 1998;67:263–70.
Stolzenberg-Solomon RZ, Miller ER 3rd, Maguire MG, et al. Association of dietary protein intake and coffee consumption with serum homocysteine concentrations in an older population. Am J Clin Nutr 1999;69:467–75.
Nieto FJ, Comstock GW, Chambless LE, Malinow RM. Coffee consumption and plasma homocyst(e)ine: results from the Atherosclerosis Risk in Communities Study. Am J Clin Nutr 1997;66:1475–85 [letter].
DeRose DJ, Charles-Marcel ZL, Jamison JM, et al. Vegan diet-based lifestyle program rapidly lowers homocysteine levels. Prev Med 2000;30:225–33.
Moens AL, Vrints Cj, Claeys MJ et al. Mechanisms and potential therapeutic targets for folic acid in cardiovascular disease. Am J Physiol Heart Circ Physiol 2008;294:H1971-H1977.
Dierkes J, Kroesen M, Pietrzik K. Folic acid and vitamin B6 supplementation and plasma homocysteine concentrations in healthy young women. Int J Vitam Nutr Res 1998;68:98–103.
Stein JH, McBride PE. Hyperhomocysteinemia and atherosclerotic vascular disease: pathophysiology, screening, and treatment. Arch Intern Med 1998;158:1301–6.
Food standards: amendment of standards of identity for enriched grain products to require addition of folic acid. Fed Regist 1996;61:8781–97.
Jacques PF, Selhub J, Bostom AG, et al. The effect of folic acid fortification on plasma folate and total homocysteine concentrations. N Engl J Med 1999;340:1449–54.
McNulty H, Dowey LR, Strain JJ, et al. Riboflavin lowers homocysteine in individuals homozygous for the MTHFR 677C>T polymorphism. Circulation 2006;113:74–80.
Ueland PM, Hustad S, Schneede J, et al. Biological and clinical implications of the MTHFR C677T polymorphism. Trends Pharmacol Sci 2001;22(4):195-201.
dbSNP – Database for short genetic variations. http://www.ncbi.nlm.nih.gov/projects/SNP/snp_ref.cgi?rs=1801133. Accessed May 2011.
Wilcken DEL, Wilcken B, Dudman NP, Tyrrell PA. Homocystinuria—the effects of betaine in the treatment of patients not responsive to pyridoxine. N Engl J Med 1983;309:448–53.
Olthof MR, Brink EJ, Katan MB, Verhoef P. Choline supplemented as phosphatidylcholine decreases fasting and postmethionine-loading plasma homocysteine concentrations in healthy men. Am J Clin Nutr 2005;82:111–7.
Olthof MR, van Vliet T, Boelsma E, Verhoef P. Low dose betaine supplementation leads to immediate and long term lowering of plasma homocysteine in healthy men and women. J Nutr 2003;133:4135–8.
Ogbonna G, Gottermeier G, Fox LS. Non-fasting plasma total homocysteine reference interval using the Vitros homocysteine assay standardized against NIST SRM 1955.Clin Chim Acta 2008;388(1-2):225-7.
Apolipoprotein B (apoB) is the major protein component of chylomicrons, very low-density lipoproteins (VLDLs), intermediate-density lipoproteins (IDLs), lipoprotein(a) [Lp(a)], and low-density lipoproteins (LDLs), and constitutes 20-25% of the total weight of LDL. Overall, because of its much longer half-life (1.5-3 days), LDL comprises > 90% of the apoB-carrying lipoproteins.
ApoB exists in two forms, deriving from the same transcript of the APOB gene: apoB-100, the full-length and most abundant protein, is 4563 amino acids in length and is found in lipoproteins synthesized by the liver including LDL, IDL, and VLDL.1,2
ApoB-48, consisting of the N-terminal 2152 amino acids (48% of the molecular weight) of apoB-100, is produced by the small intestine and is found in chylomicrons.1,2 ApoB-48 is generated when a stop codon at residue 2153 is created by RNA editing, and lacks the C-terminal LDL receptor-binding domain of apoB-100.3
Theoretically, lipids derived from exogenous dietary sources are packaged in chylomicrons containing apoB-48, whereas endogenously produced lipids from the liver are packaged in particles containing apoB-100 (VLDL, IDL, LDL). The majority of absorbed cholesterol is of endogenous, not exogenous, origin.
However, it is important to note that chylomicrons rapidly exchange their core lipids with all endogenously produced particles via cholesteryl ester transfer protein (CETP); hence, all particles carry endogenous and exogenous lipids. A critical distinction between apoB-100 and apoB-48 is that the latter is not a ligand for the LDL receptor.
Because LDL particles contain one nontransferable molecule of apoB-100 and widely varying amounts of core cholesterol and triglycerides [a normally composed LDL has a ≥ 4:1 ratio of cholesteryl ester (CE) to triglycerides (TG)], apoB is a more reliable measurement of the relative number of LDL particles than is LDL-C.
Furthermore, the very long half-life of LDLs means that they comprise more than > 90% of the circulating apoB particles; apoB is hence simply a marker of LDL-P, which is an indicator of the number of potentially atherogenic particles. ApoB-100-containing particles are cleared through the hepatic LDL receptor, which also recognizes apoE (but not apoB-48) and is thus also called the apoB/apoE receptor.
The smaller or larger LDL particles, because of changes in the configuration of apoB, are not as readily cleared as normal-sized LDLs and their half-life is 3-5 days. Much of the risk related to small LDLs is their heavy contribution to total LDL-P. Furthermore, since small LDLs carry less cholesterol per particle, individuals with apparently normal LDL-C values can have discordantly high LDL-P or apoB levels and be at risk despite unremarkable LDL-C levels.
Since the major criteria determining apoB-containing particle entry into the arterial wall is particle number, the higher levels of plasma apoB may signify increased coronary disease risk even when LDL-C is not elevated. For comprehensive cardiovascular risk assessment, because of the numerical association of apoB (90% of which represents LDL-P), it is important to consider the apoB and LDL-P metrics and remember that neither apoB nor LDL-P is reported in a standard lipid panel. It is also important to recognize that apoB is not an accurate measure of VLDL or remnant lipoproteins—it is a primarily a biomarker of LDL-P.
Clinical Interpretation
It is well established that increased plasma concentrations of apoB-containing lipoproteins are associated with an increased risk of developing atherosclerotic disease.5-11 Case-control studies have found plasma apoB concentrations to be more discriminating than other plasma lipids in identifying patients with coronary heart disease (CHD).
The utility of apoB in determining CHD risk has been confirmed by prospective studies, although the extent to which apoB concentrations are better than serum lipids in predicting risk is variable (in general, discordance is highest in insulin resistant patients who typically have a higher core LDL-TG which leads to CE depleted LDLs).9
As mentioned above, apoB is a component of all atherogenic or potentially atherogenic particles, including chylomicrons and their remnants, VLDL and their remnants, IDL, LDL, and lipoprotein(a) [Lp(a)], and each particle contains one molecule of apoB. Therefore, apoB provides a direct measure of the number of atherogenic lipoprotein particles in the circulation. However, in normotriglyceridemic and hypertriglyceridemic patients the vast majority of total plasma apoB (over 90%) is associated with LDL, making apoB an effective surrogate for LDL particle concentration.
There is now a clear consensus that, when discordant with lipid measurements, apoB is more strongly predictive of CHD than LDL-C,12-14 and a recent consensus conference report from the American Diabetes Association (ADA) and the American College of Cardiology (ACC) recognizes the importance of measured (not calculated) apoB concentrations.9,13,15
Genetic ApoB deficiency
Abetalipoproteinemia is a fetal and pediatric autosomal recessive disorder in which no apoB is produced. The condition can cause malabsorption of food lipids, severely impaired trafficking of TG and fat soluble vitamins (especially vitamin E), and polyneuropathy.16
A milder condition, hypobetalipoproteinemia, associated with very low levels of LDL-C and apoB, is fully compatible with longevity due to the absence of coronary atherosclerosis.16 In patients with hyperbetalipoproteinemia, a disorder associated with increased risk of developing CHD, apoB may be concordant or discordant with LDL-C.17
ApoB and Cardiovascular disease
Virtually all lipoprotein disorders associated with atherosclerosis are characterized by increased serum apoB concentrations. ApoB mediates the uptake of LDL particles by liver and peripheral tissue via a specific interaction with the LDL receptor.
Familial hypercholesterolemia (FH) has multiple causes but may be due to a genetic defect in the LDL receptor that prevents the clearance of LDL particles from the circulation, or to a gain-of-function mutation in the proprotein convertase subtilisin/kexin type 9 (PCSK9) gene that leads to increased catabolism of the LDL receptors (again, reduced clearance leading to elevated plasma LDL-P).18,19
An increased number of plasma LDL particles is therefore a hallmark of FH. Familial defective apoB is a related FH disorder that arises from a genetic mutation in apoB that prevents its binding to the LDL receptor, resulting in a clinical phenotype similar to FH.20
In sporadic or polygenic hypercholesterolemia, which is likely due to any number of molecular defects increasing overproduction of LDL particles, heredity plays a smaller role. This is the situation for most individuals with elevated LDL-C, due to feedback suppression of LDLR gene expression by high dietary intake of cholesterol and saturated fats and/or other modifying genetic variants.21
Hypertriglyceridemia (HTG), associated with increased LDL particle number (and therefore apoB), may be the most common underlying cause of hyperbetalipoproteinemia, usually referred to as dyslipidemia or dyslipoproteinemia. A spectrum of common and rare lipid-associated genetic variants underlies this clinically heterogeneous condition.22
Hypertriglyceridemia without increased LDL particle concentration (familial HTG) is probably not atherogenic. The high TG in this instance are a consequence of very large VLDL particles with normal apoB levels. Pancreatitis but not atherosclerosis is typical.23
Type III dysbetalipoproteinemia, associated with the apoE2/E2 genotype, is a condition characterized by high TG and high cholesterol with unremarkable LDL-P levels (but excess remnant lipoproteins, predominantly small VLDL and IDL).24 The disorder is associated with peripheral and coronary artery disease; however, additional gene and environmental factors are necessary for expression of this hyperlipoproteinemia. One study noted that individuals with elevated Lp(a) levels also appeared to have elevated small, dense LDL particles.25
The most common and perhaps underdiagnosed lipoprotein disorder is familial combined hyperlipidemia (FCHL). FCHL was originally defined as a total cholesterol and/or triglycerides concentration >95th percentile in probands with premature CHD and at least one affected first-degree relative.26 Subsequent research has identified an association of FCHL with an increase in total LDL-P (severe hyperbetalipoproteinemia) consisting of primarily small, dense LDL particles and determined that FCHL is most accurately diagnosed with a panel that includes measurement of apoB or LDL-P.27
The pathological defect in FCHL is multifactorial, including VLDL overproduction, delayed catabolism and decreased LDL clearance, as the small size of the LDL particles renders them unrecognizable to the LDL receptor. Because apoB is directly involved with defects of LDL synthesis or clearance, it is expected to play a central role in diagnosis and monitoring of these disorders.
AMORIS Study
Thompson and Danesh performed a meta-analysis of prospective studies of apoB and CHD.28 It is clear from this analysis that apoB is a significant predictor of cardiovascular disease with an overall relative risk of about 2.0 for the upper versus the lower tertile. Among the more compelling studies is the AMORIS Study because of the large number of subjects.29 More than 175,000 men and women over the age of 60 were followed up over a five-year period.
During this time, 864 men and 359 women suffered a fatal myocardial infarction (MI). After adjusting for age and traditional lipid risk factors, including LDL cholesterol, apoB remained a significant predictor of fatal MI with relative risks of 1.33 (confidence interval 1.17-1.51) and 1.53 (confidence interval 1.25-1.88) for a 1-SD increase in men and women, respectively. LDL-C was not a significant risk factor in women and was only modestly associated with MI in men.29,30
The Quebec Cardiovascular Study
This study followed 2,039 men, ages 45-76, for five years.31 ApoB was a strong, independent predictor of future cardiac events even after adjustment for age, smoking, systolic blood pressure, diabetes, and medication use. Interestingly, the investigators found a synergistic relationship between apoB and the total cholesterol/HDL cholesterol ratio (TC/HDL). When the TC/HDL ratio was low, an elevated apoB was associated with an increased risk of CHD (relative risk = 1.6), but when the TC/HDL ratio was high, an elevated apoB was associated with a markedly increased (and statistically significant) risk of CHD (relative risk = 2.6). A
13-year follow-up of the Quebec Cardiovascular Study participants also suggested a similar synergy between LDL cholesterol and apoB.32 Among the men with elevated LDL-C and a low concentration of apoB (< 128 mg/dL), relative risk for CHD was a modest 1.5, but when both LDL-C and apoB were elevated the relative risk was 2.2.
More Studies
A recent review of prospective studies comparing apoB and LDL-C as predictors of coronary artery disease and cardiovascular risk found that all but one of the 21 studies of apoB in primary prevention found a statistically significant association with CHD, even after adjustment for non-lipid risk factors.9
Of the 13 primary prevention studies that also provided data for LDL-C, only 9 reported a significant relationship between LDL-C and CHD in both men and women. Among the studies reporting both apoB and LDL-C, apoB was consistently the stronger risk factor.
The secondary prevention studies reported similar results. Baseline value of apoB was a significant predictor of recurrent cardiovascular events in the 4S, LIPID, THROMBO, and other studies.33-36 In contrast to LDL-P, neither apoB nor LDL-C was a significant predictor of recurrent events in the VAHIT Study; however, subjects were selected to have relatively low LDL-C concentrations.37
There is a wide variation in the reported relative risks for CHD in these epidemiologic studies, largely dependent on whether apoB is adjusted for other lipids and lipoproteins. Thus, the debate has become one of statistics rather than biological plausibility. The bigger issue is to not look at the patients with concordant LDL-P and LDL-C where both correlate well with outcomes, but to examine outcomes in patients where these measures are discordant.14
However, as the Quebec Cardiovascular Study and AMORIS have shown us, in large-scale studies with precise and standardized apoB measurement, apoB does appear to show statistically significant predictive effects even when traditional lipids and lipoproteins are covariates in the regression models. This is also evident in the Health Professionals Follow-up Study.38 When apoB and LDL-C were both simultaneously included in the model, relative risk for CHD was strongly associated with apoB while LDL-C and non-HDL-C were no longer statistically significant.
How to decrease ApoB
Statins are highly effective in reducing serum cholesterol through inhibition of HMG-CoA reductase, the rate- limiting enzyme in cholesterol synthesis. Subsequent depletion of hepatic cholesterol pools leads to the upregulation of LDL receptors and hence to increased clearance of LDL particles from the circulation.
Statins also reduce the production of both VLDL and subsequent LDL particles. However, the reduction in serum apoB or LDL-P concentration is not as dramatic as the reduction in LDL-C or non–HDL-C.39 As a result, patients treated to goal for LDL-C may not have achieved correspondingly low LDL particle concentrations (discordance), leaving them with potential residual risk.39-40
The Air Force/Texas Coronary Atherosclerosis Prevention Study (AFCAPS/TexCAPs) demonstrated that apoB at baseline and after one year on therapy was a strong predictor of future cardiovascular events, whereas LDL-C failed to reach significance (P=0.05 at baseline and on therapy).41 The LIPID study provided similar results.32 The reason is clear: LDL-related risk is not captured by LDL-C measurement alone.
Results from both primary and secondary statin trials suggest that on-therapy concentrations of apoB better predict future CHD events than does LDL-C.
References
Olofsson SO, Boren J. Apolipoprotein B: a clinically important apolipoprotein which assembles atherogenic lipoproteins and promotes the development of atherosclerosis. J Intern Med 2005;258(5):395-410.
Knott TJ, Pease RJ, Powell LM, Wallis SC, Rall SC Jr, Innerarity TL, et al. Complete protein sequence and identification of structural domains of human apolipoprotein B. Nature (Lond) 1986;323:734–8.
Teng B, Verp M, Salomon J, Davidson, NO. Apolipoprotein B messenger RNA editing is developmentally regulated and widely expressed in human tissues. J Biol Chem 1990;265(33):20616-620.
Jeyarajah EJ, Cromwell WC, Otvos JD. Lipoprotein particle analysis by nuclear magnetic resonance spectroscopy. Clin Lab Med 2006;26:847–70.
Kwiterovich PO Jr, Coresh J, Smith HA, et al. Comparison of the plasma levels of apolipoproteins B and A-1, and other risk factors in men and women with premature coronary artery disease. Am J Cardiol 1992;69:1015-1021
Stampfer MJ, Sacks FM, Salvini S, et al. A prospective study of cholesterol, apolipoproteins, and the risk of myocardial infarction. N Engl J Med 1991;325:373-381.
Genest J, Marlin-Munley SS, McNamara JR, et al. Familial lipoprotein disorders in patients with premature coronary artery disease. Circulation 1992;85:2025-2033
Sniderman A, Shapiro S, Marpole D, et al. Association of Coronary Atherosclerosis With Hyperapobetalipoproteinemia [increased protein but normal cholesterol levels in human plasma low density (beta) lipoproteins]. Proc Natl Acad Sci USA 1980;77:604-608
Contois JH, McConnell JP, Sethi AA, Csako G, Devaraj S, Hoefner DM, Warnick GR. Apolipoprotein B and Cardiovascular Disease Risk: Position Statement from the AACC Lipoproteins and Vascular Diseases Division Working Group on Best Practices. Clin Chem 2009;55(3):407–419
Zambon A, Braun BG, Deeb SS, Brunzell JD. Genetics of apolipoprotein B and apolipoprotein AI and premature coronary artery disease. J Intern Med 2006;259:473–80.
Willer CJ, Sanna S, Jackson AU, Scuteri A, Bonnycastle LL, Clarke R, et al. Newly identified loci that influence lipid concentrations and risk of coronary artery disease. Nat Genet 2008;40:161–9.
Sniderman AD, Williams K, Contois JH, Monroe HM, et al. A meta-analysis of low-density lipoprotein cholesterol, non-high-density lipoprotein cholesterol, and apolipoprotein B as markers of cardiovascular risk. Circ Cardiovasc Qual Outcomes 2011;4(3):337-45.
Davidson MH, Ballantyne CM, Jacobsen TA, et al. Clinical utility of inflammatory markers and advanced lipoprotein testing: Advice from an expert panel of lipid specialists. J Clin Lipidol 2011;5(5):338-367.
Otvos JD, Mora S, Shalaurova I, Greenland P, Macket RH, Goff DC. Clinical implications of discordance between low-density lipoprotein cholesterol and particle number. J Clin Lipidol 2011;5(2):105-113.
Brunzell JD, Davidson M, Furberg CD, Goldberg RB, Howard BV, Stein JH, Witztum JL. Lipoprotein management in patients with cardiometabolic risk: consensus conference report from the American Diabetes Association and the American College of Cardiology Foundation. J Am Coll Cardiol 2008;15;51(15):1512-24.
Burnett JR, Zhong S, Jiang ZG, Hooper AJ, Fisher EA, McLeod RS, et al. Missense mutations in APOB within the betaalpha1 domain of human APOB-100 result in impaired secretion of ApoB and ApoB-containing lipoproteins in familial hypobetalipoproteinemia. J Biol Chem 2007;282:24270–83.
Tarugi P, Avema M. Hypobetalipoproteinemia: genetics, biochemistry, and clinical spectrum. Adv Clin Chem 2011;54:81-107.
Nemati MH, Astaneh B. Optimal management of familial hypercholesterolemia: treatment and management strategies. Vasc Health Risk Manag 2010;6:1079-88.
Liyanage KE, Burnett JR, Hooper AJ, van Bockxmeer FM. Familial hypercholesterolemia: epidemiology, Neolithic origins and modern geographic distribution. Crit Rev Clin Lab Sci 2011;48(1):1-18.
Innerarity TL, Weisgraber KH, Arnold KS, Mahley RW, Krauss RM, Vega GL, Grundy SM. Familial defective apolipoprotein B-100: lowdensity lipoproteins with abnormal receptor binding. Proc Natl Acad Sci USA 1987;84:6919–23.
Radar DJ, Cohen J, Hobbs HH. Monogenic hypercholesterolemia: new insights in pathogenesis and treatment. J Clin Invest 2003;111(12):1795-1803.
Evans D, Aberle J, Beil FU. The relative importance of common and rare genetic variants in the development of hypertriglyceridemia. Expert Rev Cardiovasc Ther 2011;9(5):637-44
Ewald N, hardt PD, Kloer HU. Severe hypertriglyceridemia and pancreatitis: presentation and management. Curr Opin Lipidol 2009;20(6):497-504.
Schaefer JR. Unraveling hyperlipidemia type III (dysbetalipoproteinemia), slowly. Eur J Hum Genet 2009;17:541-542.
Moon JY, Kwon HM, Kwon SW, et al. Lipoprotein(a) and LDL particle size are related to the severity of coronary artery disease. Cardiology 2007;108(4):282-9.
Wierzbicki AS, Graham CA, Young IS, Nicholls DP. Familial combined hyperlipidemia: under-defined and under-diagnosed? Curr Vasc Pharmacol 2008;6(1):13-22.
Veerkamp MJ, de Graaf J, Hendriks JCM, Demacker PNM, Stalenhoef AFH. Nomogram to diagnose familial combined hyperlipidemia on the basis of results of a 5-year follow-up study. Circulation 2004;109:2980–5.
Thompson A, Danesh J. Association between apolipoprotein B, apolipoprotein AI, the apolipoprotein B/AI ratio and coronary heart disease: a literature-based meta-analysis of prospective studies. J Intern Med 2006;259:481–92.
Walldius G, Jungner I, Holme I, Aastveit AH, Kolar W, Steiner E. High apolipoprotein B, low apolipoprotein A-1, and improvement in the prediction of fatal myocardial infarction (AMORIS study): a prospective study. Lancet 2001;358:2026–33.
McQueen MJ, Hawken S, Wang X, Ounpuu S, Sniderman A, Probstfield J, et al., for the INTERHEART study investigators Lipids, lipoproteins, and apolipoproteins as risk markers of myocardial infarction in 52 countries (the INTERHEART study): a case-control study. Lancet 2008;372:224–33.
Lamarche B, Moorjani S, Lupien PJ, et al. Apolipoprotein A-1 and B levels and the risk of ischemic heart disease during a 5 year followup of men in the Quebec Cardiovascular Study. Circulation 1996;94:273-8.
St-Pierre A, Cantin B, Dagenais GR, et al. Low-density lipoprotein subfractions and the long term risk of ischemic heart disease in men: 13-year follow-up data from the Quebec Cardiovascular Study. Arterioscler Thromb Vasc Biol 2005;25:553–9.
Simes RJ, Marschner IC, Hunt D, Colquhoun D, Sullivan D, Stewart RAH. Relationship between lipid levels and clinical outcomes in the long-term intervention with pravastatin in the ischemic disease (LIPID) trial: to what extent is the reduction in coronary events with pravastatin explained by on-study lipid levels? Circulation 2002;105:1162–9.
Benn M, Nordestgaard BG, Jensen GB, Tybjaerg-Hansen A. Improving prediction of ischemic cardiovascular disease in the general population using apolipoprotein B: the Copenhagen City Heart Study. Arterioscler Thromb Vasc Biol 2007;27:661-70.
Pedersen TR, Olsson AG, Faergeman O, et al. Lipoprotein changes and reduction in the incidence of major coronary heart disease events in the Scandinavian Simvastatin Survival Study (4S). Circulation 1998;97:1453–60.
van Lennep JE, Westerveld HT, van Lennep HW, Zwinderman AH, Erkelens DW, van der Wall EE. Apolipoprotein concentrations during treatment and recurrent coronary artery disease events. Arterioscler Thromb Vasc Biol 2000;20:2408–13.
Otvos JD, Collins D, Freedman DS, Shalaurova I, Schaefer EJ, McNamara JR, Bloomfield HE, Robins SJ. Low-density lipoprotein and high-density lipoprotein particle subclasses predict coronary events and are favorably changed by gemfibrozil therapy in the Veterans Affairs High-Density Lipoprotein Intervention Trial. Circulation 2006;113:1556–63.
Pischon T, Girman CJ, Sacks FM, Rifai N, Stampfer MJ, Rimm EB. Non-high density lipoprotein cholesterol and apolipoprotein B in the prediction of coronary heart disease in men. Circulation 2005; 112:3375–83.
Sniderman AD. Differential response of cholesterol and particle measures of atherogenic lipoproteins to LDL-lowering therapy: implications for clinical practice. J Clin Lipidol 2008;2:36–42.
Walldius G, Jungner I. Apolipoprotein B and apolipoprotein AI: risk indicators of coronary heart disease and targets for lipid-modifying therapy. J Intern Med 2004;255:188–205.
Gotto AM, Whitney E, Stein EA, Shapiro DR, Clearfield M, Weis S. Relation between baseline and on-treatment lipid parameters and first acute major coronary events in the Air force/Texas Coronary Atherosclerosis Prevention Study (AFCAPS/ TexCAPS). Circulation 2000;101:477–84.
LDL-cholesterol (LDL-C) lowering by statin therapy has historically been the focus of guidelines for treating cardiovascular disease (CVD) risk associated with elevated blood cholesterol.
Treatment with statins, while well proven to be effective and widely accepted, nevertheless leaves substantial residual risk. An increased LDL particle (LDL-P) concentration has been associated with increased CVD risk even when an optimal LDL-C level has been attained.1
Recent large clinical studies have shown that for statin-treated patients, non-HDL, apoB, and LDL-P levels are better predictors of cardiovascular outcomes than LDL-C measurement alone.2 Cardiovascular disease risk is more directly related to the number of circulating atherogenic lipoprotein (apoB) particles than to the total or LDL-C concentration.2
Even though the total LDL-C concentration is often an effective surrogate marker for measuring LDL-P, LDL-C can correspond to a widely varying LDL-P number. The LDL-C concentration doesn’t account for the possibility of a high number of TG-rich LDLs (of any size) or small, dense LDL (sdLDL) particles that may be associated with a “normal” LDL-C level.1,2 Because of this, there is good reason to look beyond just LDL-C and non-HDL-C levels and focus goals of therapy on other lipid parameters.2-4
Influences of LDL-P
It takes 40-70% more cholesterol-depleted LDLs compared to cholesterol-rich LDLs to traffic a given level of LDL-C. A normally-composed LDL particle core has 4 times more CE than TG (a 4:1 CE/TG ratio). Smaller ratios indicate cholesterol depleted LDLs and the likelihood of higher LDL particle counts.
The most common scenarios leading to CE-depleted LDLs and high concentrations of LDL-P are small LDL size (even small changes in LDL particle diameter translate into significant volume changes and TG-rich LDL particles). Patients with high LDL-TG (not typically measured) have CE depleted LDLs and higher LDL-P (regardless of LDL size). A large LDL with a low CE/TG ratio will be associated with high LDL-P and a small LDL with a low CE/TG ratio will usually be associated with extreme LDL-P elevations.
Studies have demonstrated that low concentrations of LDL-P are associated with fewer CVD-related events than corresponding low levels of LDL-C.5
In a joint consensus statement, the American Diabetes Association (ADA) and the American College of Cardiology (ACC) endorsed the measurement of LDL-P by nuclear magnetic resonance (NMR) as one of the more accurate ways to evaluate cardiometabolic risk (CMR), and alerted clinicians that LDL-C levels may not be the most effective way to quantify a patient’s CVD risk.6,7,8,9
Clinical Interpretation
Even with normal or near-optimal LDL-C measurements, LDL-P concentration may be increased. Studies have shown that elevated LDL-P concentration is associated with increased risk for coronary heart disease (CHD) even in the presence of optimal LDL-C values.8 Small, dense LDL particles are often associated with the metabolic syndrome and prediabetes.
In the Multi-Ethnic Study of Atherosclerosis (MESA), LDL-P was associated with preclinical atherosclerosis (carotid intima-media thickness – CIMT), even in subjects with LDL-C <100 mg/dL (2.59 mmol/L).10
Statin Effect on LDL-P
Statins are highly effective in reducing serum cholesterol through inhibition of HMG-CoA reductase, which upregulates LDL receptors (LDLr) and leads to increased clearance of LDL particles from the circulation. However, LDL receptors are not as effective in clearing small LDL particles compared to normal-sized LDLs. Statins are the most potent drugs available to reduce LDL-P, by upregulating LDL receptors and increasing apoB particle clearance, but do not generally influence the size distribution of the LDL particles.
Drugs that can reduce production of hepatic apoB- containing particles also shift LDL size upwards and include:
All 3 of these medications are effective at lowering TG.11
It is believed that combining drugs like statins, that promote clearance of apoB particles via the LDL receptor, with drugs that inhibit apoB-particle synthesis (fibrates, niacin, and very high-dose omega-3 fatty acids) is a more effective way to achieve LDL-P (apoB) goals.9
Treatment
According to the National Cholesterol Education Program (NCEP) Adult treatment Panel (ATP)-III guidelines, clinical intervention, for patients not at goal, may include lifestyle changes and/or pharmacologic therapy.6
Therapeutic lifestyle changes can significantly reduce atherogenic lipoproteins and triglycerides and raise HDL-C levels (although neither are goals of therapy), resulting in decreased need for lipid-altering medications. NCEP ATP-III advises weight reduction, increased physical activity, and dietary changes that include reduced intake of saturated fats (< 7% of total calories) and cholesterol (< 200 mg/day), increased plant sterols (2 g/day), and increased viscous (soluble) fiber (10-25 g/day) have been demonstrated to be effective in reducing atherogenic lipoproteins.
More recent data questions the use of phytosterols (not stanols) and there is little data on fiber lowering ApoB.12 Dietary suggestions in insulin resistant populations are focusing on reducing simple carbohydrates rather than saturated fat per se. Use of whole foods containing polyunsaturated fats, especially omega-3 fatty acids, is encouraged.13
According to NCEP ATP-III, the first priority in pharmacologic therapy, if goals are not achieved with lifestyle, is to achieve LDL-C, non-HDL-C, and LDL particle number (measured apoB) goals, although several other guidelines now provide apoB and LDL-P goals.7,8,9
The most effective monotherapy treatment to reduce LDL particle number is a statin. Statin doses that lower LDL-C levels by 30-40% may provide similar percentage reduction in CHD risk over five years (standard doses).6 Additionally, combination therapy with a statin plus ezetimibe or niacin, or statin plus fenofibrate, has been shown to reduce LDL-P (statin effect).14,15 Adding very high-dose (4000 mg) omega-3 fatty acid to statins can also lower TG, shift LDL size upward and may minimally reduce LDL-P (statin effect).16
References
Kastelein JJ, van der Steeg WA, Holme I, et al. TNT Study Group; IDEAL Study Group. Lipids, apolipoproteins, and their ratios in relation to cardiovascular events with statin treatment. Circulation 2008;117:3002–3009.
Davidson M. Is LDL-C Passed Its Prime? The emerging role of non-HDL, LDL-P, and apoB in CHD Risk assessment. Arterioscler Thromb Vasc Biol 2008;28:1582-1583.3.
Sniderman AD. Apolipoprotein B versus non-high-density lipoprotein cholesterol: and the winner is. Circulation 2005; 112:3366–3367.
EI Harchaoui K, van cler Steeg,WA, Stroes ESG, et al. Value of low-density lipoprotein particle number and size as predictors of coronary artery disease in apparently healthy men and women-The EPIC-Norfolk Prospective Population Study. J Am Coll Cardiol 2007;49:547-53
Cromwell, WC, Otvos, JD, et al. LDL particle number and risk of future cardiovascular disease in the Framingham Offspring Study – implications for LDL management. J Clin Lipidol 2007;1:583-592.
Grundy SM, Cleeman JI, Bairey Merz CN, et al. Implications of recent clinical trials for the National Cholesterol Education Program Adult Treatment Panel III Guidelines. Circulation 2004;110:227-239.
Brunzell JD, Davidson M, Furberg C, et al. Lipoprotein management in patients with cardiometabolic risk. Consensus statement from the American Diabetes Association and the American College of Cardiology Foundation. Diabetes Care 2008;31:811–22.
Contois JH, McConnell JP, Sethi AA, et al. Apolipoprotein B and cardiovascular disease risk: Position Statement from the AACC Lipoproteins and Vascular Diseases Division Working Group on Best Practices. Clin Chem 2009;55(3):407–419
Davidson MH, Ballantyne CM, Jacobsen TA, et al. Clinical utility of inflammatory markers and advanced lipoprotein testing: Advice from an expert panel of lipid specialists. J Clin Lipidol 2011;5(5):338-367.
Mora S, Szklo M, Otvos JD, et al. LDL particle subclasses, LDL particle size, and carotid atherosclerosis in the Multi-Ethnic Study of Atherosclerosis (MESA). Atherosclerosis 2007;192:211–7.
Maki KC, Bays HE, Dicklin MR, et al. Effects of prescription omega-3-acid ethyl esters, coadministered with atorvastatin, on circulating levels of lipoprotein particles, apolipoprotein CIII, and lipoprotein-associated phospholipase A2 mass in men and women with mixed dyslipidemia. J Clin Lipidol 2011;5(6):483-92.
Baumgartner S, Mensink RP, Plat J. Plant sterols and stanols in the treatment of dyslipidemia: new insights into targets and mechanisms related to cardiovascular risk. Current Pharmaceutical Design 2011; 17:922-932.
Willett WC, Ludwig DS. The 2010 dietary guidelines – the best recipe for health? N Engl J Med 2011;365(17):1563-5.
AIM-HIGH Investigators. The role of niacin in raising high-density lipoprotein cholesterol to reduce cardiovascular events in patients with atherosclerotic cardiovascular disease and optimally treated low-density lipoprotein cholesterol: baseline characteristics of study participants. The Atherothrombosis Intervention in Metabolic syndrome with low HDL/high triglycerides: impact on Global Health outcomes (AIM-HIGH) trial. Am Heart J 2011;161(3):538-43.
Farnier M, Perevozskaya I, Taggart WV, et al. VAP II analysis of lipoprotein subclasses in mixed hyperlipidemic patients on treatment with ezetimibe/simvastatin and fenofibrate. J Lipid Res 2008;49(12):2641-7.
Barter P, Ginsberg HN. Effectiveness of combined statin plus omega-3 fatty acid therapy for mixed dyslipidemia. Am J Cardiol 2008;102(8):1040-5.
Effects of eicosapentaenoic acid on major coronary events in hypercholesterolaemic patients (JELIS): a randomised open-label, blinded endpoint analysis. Yokoyama M1, Origasa H, Matsuzaki M, Matsuzawa Y, Saito Y, Ishikawa Y, Oikawa S, Sasaki J, Hishida H, Itakura H, Kita T, Kitabatake A, Nakaya N, Sakata T, Shimada K, Shirato K; Japan EPA lipid intervention study (JELIS) Investigators. Lancet. 2007 Jul 21;370(9583):220.
Alpha-hydroxybutyrate (α-HB), Linoleoyl-glycerophosphocholine (L-GPC), Oleic Acid, and the IRi Score Test Guide
Test Description
Insulin resistance (IR) plays a fundamental role in the pathogenesis of metabolic syndrome (MetS) and type-2 diabetes mellitus (T2DM).1,2 Insulin Resistance is a continuous variable defined as a decrease in the effectiveness of a given amount of insulin to lower blood glucose levels.
When IR develops in an individual, the pancreatic β cells must produce increased amounts of insulin to control blood glucose. This compensatory response results in the characteristic state of hyperinsulinemia associated with IR, and simultaneously initiates a process of cellular injury and functional decline in the β cells. Eventually, the demand placed on the β cells by insulin resistance exceeds their ability to increase insulin production, and blood glucose levels rise, resulting in prediabetes.
Prediabetes includes impaired fasting glucose (IFG), impaired glucose tolerance (IGT), impaired postprandial glucose (IPG), and combined glucose intolerance (CGI = IFG+IGT or IFG+IPG). Even in the absence of hyperglycemia, IR contributes to the development of cardiovascular disease via effects of hyperinsulinemia on liver lipoprotein metabolism and vascular function.
Insulin Resistance is the earliest detectable metabolic abnormality in individuals at risk for developing T2DM, and may be present decades before hyperglycemia develops (Figure 1).3Though the rate of progression from Insulin Resistance to frank T2DM varies substantially among individuals, it is well established that the presence of IR in an otherwise healthy individual is a strong predictor of incident T2DM.
Importantly, interventions that reduce IR, such as diet, exercise, or insulin-sensitizing medications like metformin or thiazolidinediones (pioglitazone/Actos®), are also effective in preventing T2DM. Therefore, quantitative measurement of IR is not only useful for detecting risk, but also provides a therapeutic index that provides information about efficacy of different interventions and/or the rate of disease progression in an individual over time.
Because IR typically precedes hyperglycemia by many years and promotes cardiovascular disease independently of hyperglycemia, undiagnosed patients with IR frequently present with advanced cardiovascular disease (CVD) at the time of their initial diagnosis with prediabetes or Type-2 diabetes. Hence, a more rational approach to primary prevention of cardiovascular morbidity and mortality requires earlier diagnosis and intervention, ideally at the point when IR is first detected.
Current diagnostic tests such as blood glucose levels and HbA1c primarily detect prediabetes or diabetes and are severely limited as tools for early detection of insulin resistance. Since hyperglycemia typically does not develop until later stages of the disease process, elevated glucose or A1c occur at a point when interventions may be less effective.4-6 Plasma insulin concentrations are usually elevated in the setting of IR. However, the fasting insulin levels typically measured in clinical settings can vary considerably from day to day in the same individual, limiting their sensitivity and specificity for detecting insulin resistance; in addition, this variability impedes use of fasting insulin levels for monitoring therapeutic responses or the rate of disease progression in an individual patient over time. Moreover, although fasting insulin levels rise in early IR, they can fall again due to β-cell exhaustion in later disease (Figure 1). In contrast, plasma insulin level measured at multiple time-points during a 75 gm, 2 hour oral glucose tolerance test (OGTT) is a powerful tool for both detecting and monitoring IR. However, administering the OGTT with multiple blood draws is beyond the scope of most clinical practices, because it is generally considered too intensive in terms of both time and labor to be used in outpatient settings.
HDL, Inc. is utilizing a patented set of novel small molecule (metabolite) biomarkers to diagnose, quantify, and monitor IR in individual patients over time. These biomarkers were discovered by analyzing the blood of almost 400 insulin-resistant and normal individuals from the RISC (Relationship of Insulin Sensitivity to Cardiovascular Risk) Study, a cohort of clinically characterized nondiabetic individuals,7 to identify several molecules that together present a characteristic pattern of change indicative of insulin resistance (Figure 2). Study subjects were nondiabetic, healthy individuals representing a broad spectrum of insulin sensitivity and glucose tolerance (based on euglycemic-hyperinsulinemic [HI] clamp studies and OGTT).7 485 small molecule metabolites were measured in the blood of each individual by tandem mass spectrometry. This unique metabolomics approach was considered “unbiased” and “hypothesis-free,” because it involved comprehensive measurement of as many endogenous metabolites as possible without any preconceived notions of which ones would be most likely to detect insulin resistance.8 In contrast, traditional disease biomarkers are employed because they are known a priori to relate to some particular aspect of a disease process; as a result, they already correlate with established risk factors for the disease and may therefore provide relatively little additional predictive value.
Of the 485 metabolites screened, alpha-hydroxybutyrate (α-HB) was most significantly associated with IR (measured by the HI clamp) and prediabetes (measured by OGTT).7 A previously unrecognized metabolite, α-HB is an organic acid positioned at the crossroad between amino acid catabolism and glutathione synthesis, just upstream of the tricarboxylic acid (TCA) cycle (Figure 3). It is produced in the liver as a byproduct during the formation of α-ketobutyrate (α-KB), a substrate for cellular energy that is also produced during the formation of the antioxidant glutathione in the setting of hepatic oxidative stress. Therefore, α-HB is elevated in states of increased oxidative stress, increased glutathione demand, impaired mitochondrial energy metabolism, and lipid oxidation, a metabolic feature of IR.9,10 A model has been proposed linking α-HB production to the free fatty acid-rich environment of obesity/insulin resistance—exemplified in the metabolic syndrome and T2DM—with changes in methionine oxidation and glutathione generation, tissue redox balance, and attenuated TCA capacity of insulin- resistant tissues (Figure 3).9,10 In addition, the finding of a positive association between free fatty acid (FFA) levels and plasma α-HB levels in the RISC cohort supports the possibility that an increased NADH/NAD+ ratio favors production of α-HB (Figure 3).7
The next top-ranking biomarker of IR identified by metabolomics was linoleoyl-glycerophosphocholine (L-GPC), a putative lipid-signaling molecule.7 A third high-ranking metabolite, oleic acid was identified. Oleic acid is
a monounsaturated omega-9 fatty acid produced from stearic acid (C18) through the action of stearoyl coA- desaturase (SCD1). In the fasting state, circulating oleic acid levels do not reflect mealtime dietary intake. Oleic acid is the predominant fatty acid of triglycerides normally stored in human adipose tissue, and also those that accumulate in liver in non-alcoholic fatty liver disease (hepatic steatosis).11,12 Since stearic acid is plentiful in most modern diets, increased fasting levels of circulating oleic acid may reflect increased SCD1 activity in fat and liver. Since SCD1 is strongly induced by dietary carbohydrates, elevated oleic acid may specifically reflect end-organ damage from excess carbohydrate-intake—a known risk factor for metabolic syndrome and T2DM—in these tissues.13
Elevated plasma concentrations of α-HB and L-GPC have also been shown to mark for the presence of fatty liver disease independently of sex and age.14 In fact, α-HB may play a direct role in the pathogenesis of IR by inhibiting mitochondrial ATP synthesis in muscle tissue (Metabolon, Inc., personal communication). Evidence also shows that aging is associated with a reduction in plasma L-GPC, and that aerobic exercise can increase plasma L- GPC, along with insulin sensitivity.15
Combining plasma insulin along with α-HB, L-GPC, and oleic acid, generates a composite index for quantifying IR, referred to as “IRi score”. The IRi score provides a more comprehensive assessment of IR than any one metabolite and improves the ability to define where an individual lies on the continuum of diabetes development.16 In comparison to other methods for quantifying IR—including HOMA-IR and the oral glucose sensitivity index derived from OGTT testing—the IRi score exhibits superior correspondence to the gold standard HI clamp measurement of IR.4-6
The three metabolites, α-HB, L-GPC, and oleic acid, are measured at HDL, Inc. by tandem mass spectrometry. Plasma insulin, which is additionally used to calculate the IRi score, is measured by immunoassay. The IRi score is derived as described by Cobb et al.16
Clinical Interpretation
Monitoring changes in fasting plasma α-HB has been shown to alert physicians to early-stage IR and risk for T2DM or CVD. In the initial metabolomics discovery study, levels of α-HB were consistently and significantly higher in the IR subjects with normal glucose tolerance (NGT) compared to normal insulin-sensitive (IS) subjects (p < 0.0001).7Furthermore, α-HB was able to distinguish insulin-sensitive subjects with NGT (NGT-IS) from insulin-resistant subjects with NGT (NGT-IR), with 76% accuracy, thus providing a highly useful, early indicator of IR. α-HB levels were significantly higher in the NGT-IR, IFG, and IGT groups as compared to the NGT-IS group (p < 0.0001). α-HB concentrations ≥ 5 µg/mL were found to best distinguish NGT-IR from NGT- IS subjects. Individuals in the upper tertile of α -HB concentration (≥ 5.9 µg/mL) were significantly more likely to have both IR (odds ratio 3.26, p < 0.0001) and IGT (odds ratio 2.72, p < 0.0001). Finally, α-HB was also found to separate individuals with NGT from those with prediabetes (IFG or IGT) independently of, and in addition to, IR (odds ratio 2.51, p < 0.0001). Importantly, these associations were independent of sex, age, and BMI. Thus, together with other biomarkers, α-HB provides a diagnostic tool to identify IR with or without prediabetes at an earlier stage of the disease process than currently used clinical tests.7
The second IR biomarker identified from this analysis, L-GPC, significantly decreased in concentration with increasing IR and dysglycemia.7 In a large follow-up study, the predictivity of α-HB and L-GPC for incident dysglycemia was observed in two observational cohorts, comprising 1,048 nondiabetic participants from the RISC study and 2,580 from the Botnia Prospective Study, with 3-year and 9.5-year follow-up data, respectively. In both cohorts, fasting α-HB was positively associated, and L-GPC negatively associated with insulin resistance, independent of other known predictors and independent of one another (p < 0.0001). In addition, α-HB was reciprocally related to indices of β-cell function derived from the oral glucose tolerance test (OGTT; p = 0.0002).17
In the RISC cohort, α-HB levels in the top quartile of its distribution (> 5.48 µg/mL) compared to the bottom quartile conferred a relative risk for IR of 2.84, whereas an L-GPC concentration in the bottom quartile of its distribution (< 11.78 µg/mL) conferred a risk of 3.14. Moreover, in the 122 NGT subjects falling in the highest
α-HB quartile and the lowest L-GPC quartile, the relative risk for IR was 4.14. Changes in α-HB and L-GPC over time tracked with their ability to predict development of prediabetes; after 3 years, α-HB had risen (p = 0.0003) and L-GPC had fallen (p < 0.05) in subjects who progressed to dysglycemia compared with stable NGT subjects. Similar data were obtained in the Botnia study cohort.17 Compared with other selected amino acids and branched- chain amino acids reported to be markers of obesity and insulin resistance and predictive of diabetes,18,19 α-HB and L-GPC were more sensitive markers of IR, e.g., able to discriminate IS from IR individuals in both NGT and IGR ranges.17Increased α-HB and decreased L-GPC levels thus serve as “readouts of metabolic overload (elevated NADH/NAD+ ratio)” and reduced glucose metabolism in both IR and the earliest phases of prediabetes.17
Follow-up work combined α-HB and L-GPC into an algorithm (the IRi score) developed from an expanded analysis of the RISC cohort.16 This IRi score, based on multiple regression and incorporating α-HB, L-GPC, oleic acid, and fasting insulin, successfully identifies individuals in the lowest tertile of insulin sensitivity (as measured by the HI clamp), with an receiver-operating characteristic area under the curve (ROC-AUC) of 0.79 (p < 0.001).16 The ROC-AUC is a measure of optimal sensitivity and specificity where 1.0 would denote a perfect study with 100% positive predictive value and 100% negative predictive value. Remarkably, the IRi score was also statistically equivalent to the HI clamp itself in predicting conversion from NGT to IGT in a 3-year follow-up of the RISC subjects (ROC-AUC = 0.70, n = 899).16 In a cross-sectional analysis of 543 individuals from the Botnia
Prospective Study, the algorithm was measured and compared in those who progressed to T2DM versus those who did not.17 Over a 3-year period, the top-ranking insulin sensitivity metabolites, α-HB and L-GPC alone, predicted progression to T2DM with AUCs of 0.73 (p < 0.005) and 0.69 (p < 0.05), whereas the IRi algorithm exhibited an ROC-AUC of 0.80 (p = 0.00002).20
In summary, these insulin sensitivity markers—α-HB, L-GPC, oleic acid, and the associated IRi score— measured in a fasting plasma sample, can identify high-risk, insulin-resistant subjects with very high accuracy early in the disease process, and provide an early indication of risk for progression to prediabetes and T2DM.
Treatment Considerations
α-HB alone, and combined with L-GPC, oleic acid, and insulin in the IRi score, acts as a highly sensitive biomarker of early insulin resistance and progression toward prediabetes, even in normoglycemic individuals. Together with other biochemical and clinical parameters these metabolites can accurately detect subclinical abnormalities of glucose metabolism. The IRi score demonstrates expected improvement upon successful treatment with pharmacological insulin-sensitizer therapies.21
By identifying individuals at significantly increased risk for prediabetes and diabetes, appropriate dietary, lifestyle, and perhaps pharmaceutical interventions can be implemented to prevent/reverse disease progression. The IRi score may subsequently be useful for tracking the restoration of insulin sensitivity associated with improvements in patients’ glycemic status.
In summary:
The IRi score and its constituent metabolites fill a gap in clinical care for earlier detection of high-risk IR patients and dysglycemia. Each of the 4 analytes contributes complementary and unique information from different metabolic pathways related to insulin function.
This is a practical, fasting metabolic test for improved detection and management of high-risk, dysmetabolic IR patients and for quantifying the risk of progression to T2DM.
Simple measurement from fasting blood of analytes α-HB, L-GPC, and oleic acid allow the physician to identify patients with IR in its earliest stages as well as monitor the effectiveness of anti-diabetes therapies.
Pioglitazone modulates these 3 analytes by reducing plasma α-HB and oleic acid andincreasing
L-GPC concentrations, in proportion to improvement in insulin sensitivity.21The IRi score can thus be used to track improvement in ACTOS®-treated prediabetics.
The IRi score has strong clinical data validating its correlation with the euglycemic hyperinsulinemic clamp, the gold standard for measuring IR.
α-HB and the IRi score may improve patient care and compliance with lifestyle and/or medication adherence, thereby, more effectively preventing or delaying disease and IR complications in diabetes and CVD.
α-HB and the IRi score will enhance CVD risk and glycemic diagnostic panels by allowing physicians to measure IR directly and assess cardiometabolic risk more sensitively andaccurately.
NOTE: Other factors may contribute to elevated serum and/or urinary α-HB levels, via increases in the NADH/NAD+ ratio associated with lipid oxidation or increased glutathione demand due to oxidative stress. These may include heavy alcohol consumption, smoking, poor diet, and acute viral infections.10,22,23
If FPG and HbA1c are abnormal, follow therapeutic guidelines of the American Diabetes Association. The following lifestyle recommendations and medications can be used to reduce insulin resistance and improve β-cell function, personalized to the individual patient’s clinical needs.
Lifestyle24-30:
Limit carbohydrates (especially simple sugars and processed carbohydrates) while maintaining moderate fat intake
Weight loss (as appropriate)
Regular exercise (150 minutes/week combining cardiovascular activity at a moderate-to-vigorous pace with resistance training)
Medication choices may include:
Metformin (e.g., Glucophage®, Glumetza®)
Pioglitazone (Actos®)
Incretin mimetics (GLP-1 agonists)
DPP-4 inhibitors
Quick-release bromocriptine mesylate (Cycloset®)
Alpha-glucosidase inhibitors (acarbose)
NOTE: No medications are currently FDA approved for the treatment of insulin resistance or β-cell dysfunction. Insulin may be considered for the treatment of hyperglycemia meeting ADA criteria for diabetes but should NOT be used in the setting of insulin resistance without diabetes or in prediabetes due to the potential for hypoglycemia.31 Patients who are taking metformin are at increased risk for vitamin B12 deficiency and may benefit from sublingual vitamin B12 supplementation.32
References
DeFronzo RA, Ferrannini E. Insulin resistance. A multifaceted syndrome responsible for NIDDM, obesity, hypertension, dyslipidemia, and atherosclerotic cardiovascular disease. Diabetes Care 1991;14(3):173-94.
Duvnjak L, Duvnjak M. The metabolic syndrome – an ongoing story. J Physiol Pharmacol 2009;60 Suppl 7:19-24.
Defronzo RA. Banting Lecture. From the triumvirate to the ominous octet: a new paradigm for the treatment of type 2 diabetes mellitus. Diabetes 2009;58(4):773-95.
Borai A, Livingstone C, et al. Selection of the appropriate method for the assessment of insulin resistance. BMC Med Res Methodol 2011;11:158.
Herder C, Karakas M, et al. Biomarkers for the prediction of type 2 diabetes and cardiovascular disease. Clin Pharmacol Ther 2011;90(1):52-66.
Goldfine AB, Gerwien RW, et al. Biomarkers in fasting serum to estimate glucose tolerance, insulin sensitivity, and insulin secretion. Clin Chem 2011;57(2):326-37.
Gall WE, Beebe K, et al. alpha-hydroxybutyrate is an early biomarker of insulin resistance and glucose intolerance in a nondiabetic population. PLoS ONE 2010;5(5):e10883.
Suhre K, Meisinger C, et al. Metabolic footprint of diabetes: a multiplatform metabolomics study in an epidemiological setting. PLoS ONE 2010;5(11):e13953.
Adams SH. Emerging perspectives on essential amino acid metabolism in obesity and the insulin-resistant state. Adv Nutr 2011;2(6):445-56.
Lord RS, Bralley JA. Clinical applications of urinary organic acids. Part I: Detoxification markers. Altern Med Rev 2008;13(3):205-15.
Hodson L, Fielding BA. Stearoyl-CoA desaturase: rogue or innocent bystander? Prog Lipid Res 2013;52(1):15-42.
Ntambi JM, Miyazaki M. Recent insights into stearoyl-CoA desaturase-1. Curr Opin Lipidol 2003;14(3):255-61.
Wolever TM, Mehling C. Long-term effect of varying the source or amount of dietary carbohydrate on postprandial plasma glucose, insulin, triacylglycerol, and free fatty acid concentrations in subjects with impaired glucose tolerance. Am J Clin Nutr 2003;77(3):612-21.
Gastaldelli A, Natali A, et al. α-hydroxybutyrate and linoleoyl-glycerolphosphocholine as new markers of fatty liver disease [abstract]. Diabetes 2011;60(Suppl 1):A453.
Garcia J, Lum H, et al. Effect of aging and exercise on novel insulin sensitivity marker linoleoyl-glycerophosphocholine [abstract]. Diabetes 2012;61(Suppl 1):A181.
Cobb J, Gall W, et al. A novel fasting blood test for insulin resistance and prediabetes. J Diabetes Sci Technol 2013;7(1):100-10.
Ferrannini E, Natali A, et al. Early metabolic markers of the development of dysglycemia and type 2 diabetes and their physiological significance. Diabetes 2013;62(5):1730-7.
Newgard CB. Interplay between lipids and branched-chain amino acids in development of insulin resistance. Cell Metab 2012;15(5):606-14.
Wurtz P, Makinen VP, et al. Metabolic signatures of insulin resistance in 7,098 young adults. Diabetes 2012;61(6):1372-80.
Gall W, Mitchell MW, et al. Metabolic markers of insulin sensitivity predict progression to IGT and T2D [abstract]. Diabetes Metab 2011;60(Suppl 1):A414.
Tripathy D, Gall W, et al. Pioglitazone improves insulin sensitivity by modulating novel biomarkers: results from the ACTNOW study [abstract]. Diabetologia 2011;54(Suppl 1):S30.
22. Imaki M, Kawabata K, et al. Evaluation of the effects of various factors on the serum alpha hydroxybutyrate dehydrogenase activity in
young females. Appl Human Sci 1995;14(6):297-302.
23. Silva AR, Ruschel C, et al. Inhibition of in vitro CO2 production and lipid synthesis by 2-hydroxybutyric acid in rat brain. Braz J Med Biol
Res 2001;34(5):627-31.
24. Mirza NM, Palmer MG, et al. Effects of a low glycemic load or a low-fat dietary intervention on body weight in obese Hispanic American
children and adolescents: a randomized controlled trial. Am J Clin Nutr 2013;97(2):276-85.
25. Yki-Jarvinen H. Nutritional modulation of nonalcoholic fatty liver disease and insulin resistance: human data. Curr Opin Clin Nutr Metab
Care 2010;13(6):709-14.
26. Bradley U, Spence M, et al. Low-fat versus low-carbohydrate weight reduction diets: effects on weight loss, insulin resistance, and
cardiovascular risk: a randomized control trial. Diabetes 2009;58(12):2741-8.
27. Ross R, Janssen I, et al. Exercise-induced reduction in obesity and insulin resistance in women: a randomized controlled trial. Obes Res
2004;12(5):789-98.
28. O’Hagan C, De Vito G, et al. Exercise prescription in the treatment of type 2 diabetes mellitus : current practices, existing guidelines and
future directions. Sports Med 2013;43(1):39-49.
29. Davidson LE, Hudson R, et al. Effects of exercise modality on insulin resistance and functional limitation in older adults: a randomized
controlled trial. Arch Intern Med 2009;169(2):122-31.
30. Williams MA, Haskell WL, et al. Resistance exercise in individuals with and without cardiovascular disease: 2007 update: a scientific
statement from the American Heart Association Council on Clinical Cardiology and Council on Nutrition, Physical Activity, and
Metabolism. Circulation 2007;116(5):572-84.
31. Aguilar RB. Evaluating treatment algorithms for the management of patients with type 2 diabetes mellitus: a perspective on the definition
of treatment success. Clin Ther 2011;33(4):408-24.
32. Moore EM, Mander AG, et al. Increased risk of cognitive impairment in patients with diabetes is associated with metformin. Diabetes
Leptin was discovered in 1994 when Friedman and colleagues performed positional cloning of the obgene, responsible for a recessive mutation found decades earlier to cause obesity in the homozygous ob /obmouse.1The researchers discovered that this gene encodes a secreted peptide hormone, expressed almost exclusively in adipose tissue, which they named “leptin.”
Deficiency of leptin in the homozygous ob /obmice causes morbid obesity, severe insulin resistance, hyperglycemia, hyperphagia (uncontrolled eating behavior), decreased energy expenditure, lethargy, central hypothyroidism, and other neuroendocrine abnormalities.1,2 Treatment of ob /ob mice with purified leptin reduces food intake, normalizes insulin-glucose homeostasis, increases energy expenditure, and reduces body weight.3,4
Leptin acts primarily on the hypothalamus to induce metabolic changes in brown adipose tissue and skeletal muscle via the sympathetic nervous system; specifically, leptin enhances mitochondrial function and induces the mitochondrial uncoupling protein UCP1 in these tissues, producing an enormous increase in energy expenditure via thermogenesis (body heat production).5 Because lipids (fatty acids in particular) are the primary fuel substrate for mitochondrial thermogenesis, leptin treatment also reverses the pathological accumulation of lipid (i.e., lipotoxicity) that causes insulin resistance and glucose intolerance in ob /ob mice.6 The net effect of these changes is rapid weight reduction and normalization of insulin-glucose homeostasis in leptin-treated ob /obmice.3
Identification of the human leptin gene (OBor LEP ) in 1995 opened the possibility of using leptin to treat human obesity, insulin resistance, and diabetes.7 This possibility was confirmed in part with the discovery of individuals with recessive loss-of-function mutations in the human leptin gene. These mutations are extremely rare, with only a handful of affected families discovered worldwide in the past decade.8 Analogous to the ob/obmice, a leptin deficient individual has no detectable circulating leptin and is obese, hyperphagic, and severely insulin-resistant from early childhood. Treatment with recombinant human leptin reverses all of these defects and normalizes metabolism in these individuals in a matter of weeks.9
Leptin has also been found to be effective in reducing metabolic abnormalities in individuals who lack normal adipose tissue depots due to congenital or acquired generalized lipodystrophies.10,11 Unlike individuals with genetic leptin deficiency, lipodystrophic individuals are exceedingly lean and produce little or no leptin due to the lack normal adipose tissue (where leptin is normally produced).12 Lipodystrophic individuals adapt to the inability to store lipids in fat by inappropriately storing them in other tissues such as muscle and liver, resulting in severe lipotoxic insulin resistance, diabetes, and eventually fulminant liver failure due to steatohepatitis.13 Leptin treatment of lipodystrophic individuals reverses or ameliorates these metabolic derangements.
Despite these examples of beneficial effects of leptin treatment, studies with purified recombinant human leptin in common types of obesity were disappointing: most individuals with obesity exhibit little or no change in weight with leptin treatment.14,15 Why is this?
Leptin regulates feeding behavior and metabolism
The brain (hypothalamus) receives information from “adiposity signals” such as the hormones insulin and leptin (reflecting long-term energy availability) and signals from nutrients such as glucose and free fatty acids (reflecting short-term energy availability).16,17
When there is sufficient access to food and body fat stores are ample, feeding behavior and metabolism should be adjusted to decrease energy intake (enhance the sense of satiety) and endogenous glucose production, while simultaneously increasing energy expenditure and mobilizing fat stores.18
On the other hand, if the brain has decreased signal input from these “adiposity signals” then the brain adjusts metabolism to increase nutrients in the blood stream. In part, this is accomplished by increasing glucose production (gluconeogenesis) in the liver.19 With the consequent rise in body fat content and blood glucose levels, blood levels of leptin, insulin, and free fatty acids also increase, providing negative feedback to the brain and restoring food intake and glucose production to their former values.15
Leptin production is directly coupled to fat mass, obese people generally exhibit unusually high circulating levels of leptin that are sustained over many years. This chronic elevation of leptin in obesity, along with hyperinsulinemia and other metabolic derangements, are believed to produce a state of “leptin resistance” in the hypothalamus.16 In effect, the primary pathway through which leptin controls appetite and metabolism becomes inherently flawed at some point in obese individuals, such that the brain does not adequately receive or relay the signal to decrease food intake and increase energy expenditure.
Leptin:BMI Ratio
It is now recognized that leptin resistance may be variable among obese individuals. Calculation of the plasma leptin:body mass index (BMI) ratio (i.e., a “BMI-adjusted” leptin level) is one way to quantify severity of leptin resistance in obese individuals.20
Leptin:BMI ratios vary substantially among obese individuals, because circulating leptin levels reflect both total adipose tissue mass (estimated by BMI) and the severity of hypothalamic leptin resistance. Sympathetic enervation of adipose tissue and circulating catecholamines normally suppress production and release of leptin by adipose tissue.21,22
Leptin resistance in the hypothalamus and the subsequent decreased sympathetic outflow to fat produces even greater production and release of leptin (further aggravating hypothalamic leptin resistance in a feed-forward manner). Therefore, if circulating leptin levels are in excess to fat mass (estimated by BMI), it is indicative of a more severe state of leptin resistance. The leptin:BMI ratio provides a quantitative assessment for the severity of leptin resistance in obesity.
For the same age and BMI, women have significantly higher leptin concentrations than men (mean levels: women 14.13 pg/mL vs. men 5.73 pg/mL).23
Leptin risk ranges are:
High risk: > 43 ng/mL
Intermediate risk: 20–43 ng/mL
Optimal: < 20 ng/mL
The risk ranges for the Leptin:BMI ratio are:
High-risk: > 1.17
Intermediate risk: 0.66–1.17
Optimal: < 0.66
Clinical Interpretation
While absolute leptin deficiency causes obesity, most obese individuals exhibit elevated circulating plasma leptin levels—as would be expected, given that leptin is synthesized and secreted by adipocytes in direct proportion to total body fat mass.16
Leptin resistance
Sustained elevations in plasma leptin levels are associated with obesity, overeating, and inflammation-related diseases including hypertension, metabolic syndrome, and cardiovascular disease (CVD).24It is thought that increases in leptin level (in response to caloric intake) act as an acute response mechanism to prevent excess cellular stress caused by over-eating when adipose tissue depots are already replete, which can lead to ectopic fat storage within internal organs, arteries, and muscle.25 In other words, Leptin is trying to keep you from over-eating.
The postprandial rise in circulating insulin levels induces an increase in leptin in a dose-dependent fashion. This effect is enhanced by high cortisol levels.26However, although most obese individuals have high leptin levels, these common forms of obesity are associated with acquired impairment in the response to elevated leptin levels, which therefore do not induce the expected reduction in feeding and body weight that would mitigate obesity.
Furthermore, although recombinant leptin can be used to treat the rare monogenic form of leptin deficiency and the generalized lipodystrophies, administering the hormone to obese individuals does not always induce weight loss as predicted, suggesting that they may be resistant to the effects of leptin.27
Such “leptin resistance” is thought to be an important component in the development of obesity and is somewhat analogous to “insulin resistance,” wherein elevated insulin levels are required to maintain blood glucose levels in the normal range.27,28The chronic hyperleptinemia which characterizes obesity decreases the transport of leptin into the central nervous system (CNS) and/or impairs the signaling properties of leptin receptors such that acute leptin responses do not adequately signal “fullness” to the brain to curb hunger.
This confers increased susceptibility to diet-induced obesity, which in turn raises leptin levels further and worsens leptin resistance, leading to a vicious cycle of weight gain. Therefore in addition to being a major cause of obesity, leptin resistance is also an important consequence.28-30
Leptin controls feeding not just by providing a physiological satiety signal, but also by modulating the perception of reward associated with feeding.30This action of leptin probably occurs at the level of the mesolimbic dopaminergic system, and may explain the weight gain commonly induced by antipsychotic drugs, which act as mixed dopamine receptor antagonists.31
Based on existing knowledge, obese individuals with more severe leptin resistance are likely to struggle more with dieting and weight loss through lifestyle interventions and may experience rebound of weight gain more quickly after weight loss; in addition, these individuals may exhibit more severe insulin resistance along with an increased number and severity of components of the metabolic syndrome (e.g., hyperglycemia, central adiposity, hypertension, hypertriglyceridemia, and reduced HDL-cholesterol).17
Since production of adiponectin by adipose tissue is generally suppressed by worsening insulin resistance, the leptin:adiponectin ratio may be useful in assessing the synergistic metabolic impairment caused by insulin resistance and leptin resistance in a given individual. Consistent with this, several recent studies have demonstrated that the leptin:adiponectin ratio is a novel, independent predictor of type 2 diabetes (T2DM) and CVD.32-35
Leptin affects glucose metabolism and insulin sensitivity in peripheral tissues
Outside of the Central Nervous System, leptin can directly affect glucose metabolism by enhancing insulin action in the skeletal muscle, liver, adipose tissue, and by improving function of the pancreatic β cells.36Leptin suppresses insulin secretion from the pancreas, decreases the production of glucose in the liver, and increases glucose and fatty acid oxidation in both muscle and adipose tissue.36,37Most of the effects of leptin are mediated on these tissues indirectly via leptin actions in the hypothalamus.
Consistent with this, epidemiologic data show a strong association between insulin resistance and the chronically increased leptin levels associated with leptin resistance (reviewed in 38). The hyperinsulinemia ensuing from insulin resistance plus loss of the protective effects of leptin action can augment the exhaustion and apoptosis of pancreatic β cells, eventually resulting in T2DM.39,40Pancreatic β cells have leptin receptors and leptin may also be an important direct regulator of β-cell function at different levels including insulin gene expression, insulin secretion, cell growth, and apoptosis.36,38
Although leptin treatment reduces insulin levels and enhances insulin sensitivity in various hypoleptinemic states (primarily by decreasing body weight and fat mass),41 it does not improve insulin sensitivity in obese individuals or those with T2DM for whom leptin excess is associated with leptin resistance.38,42
Leptin and inflammation
A link exists between obesity and chronic inflammation, and it has been proposed that leptin regulates some aspects of the inflammatory response. Leptin production is acutely increased during infection and inflammation.43,44 Elevated leptin also affects the hypothalamic-pituitary-adrenal (HPA) axis and is associated with raised white blood cell counts, indicating a role in the physiological stress response.45,46
Factors that influence inflammatory markers in general can acutely affect leptin levels. In such situations leptin may no longer strictly correlate with body fat mass:43,44
Leptin levels decrease after short-term fasting (24–72 hour), even when body fat mass does not.47
Leptin levels are elevated in obese patients with obstructive sleep apnea, but decrease after CPAP treatment.48
Sleep deprivation reduces leptin levels (leptin is released into the circulation in a pulsatile fashion, following a circadian rhythm, and hence is affected by sleep patterns).49,50 However, sleep disturbances have been shown to increase leptin levels in women of normal weight who have depressed mood.51
Chronic exercise training decreases leptin levels.52
Leptin levels are decreased by testosterone and increased by estrogen.54
Renal failure results in higher leptin levels.55 Leptin levels may be higher in women at the luteal phase of the menstrual cycle, and menopause is associated with a decline in circulating leptin.56,57
Leptin and cardiovascular disease
The relationship between leptin and CVD is complex.58-60 Leptin is necessary for normal cardiac function, as it plays a critical role in preventing cardiac lipotoxicity (lipid accumulation) in obesity.61
In animal models of leptin deficiency, leptin treatment also reduces cellular damage via suppression of cardiomyocyte apoptosis in animal models of ischemia reperfusion injury.62 However, leptin deficiency in animals is distinctly different from the phenomena of leptin resistance and hyperleptinemia that typify normal human obesity.
Hyperleptinemia is present in patients with coronary heart disease, chronic heart failure, hypertension, stroke, and in those at increased risk of myocardial infarction (MI).42,58,59,63 Hyperleptinemia may play a direct role in the pathogenesis of CVD by inducting platelet activation, smooth muscle cell proliferation, endothelial dysfunction, and oxidative stress.64
Consistent with these pro-atherogenic effects, elevated plasma leptin concentrations are independently associated with carotid intimal-medial thickness (CIMT) and with coronary artery calcification score in patients with T2DM, even after controlling for adiposity.60
These pro-atherogenic effects of leptin have obvious negative implications for obese individuals exhibiting leptin resistance. Nevertheless, the complex association between leptin and cardiac function may be one factor underlying the so-called “obesity paradox”; i.e., the observation that survival from certain CVD-related endpoints may be paradoxically increased in individuals with increased BMI.”65
Treatment
To date, several interventional studies have been performed to evaluate the effects and safety of leptin administration in lipoatrophic or obese patients with hypoleptinemia. Administering recombinant human leptin can reverse the obesity of leptin-deficient (but NOT leptin-resistant) individuals and corrects many of the associated metabolic abnormalities including diabetes, dyslipidemia, and hepatic steatosis.66-68
Clinical trials are ongoing to find a modified, more potent therapeutic with a longer half-life, to reduce the frequency of injections and accompanying skin inflammation.69-71 Leptin replacement to children with congenital leptin deficiency remarkably ameliorates hyperinsulinemia and hyperlipidemia.72 Recent randomized trials demonstrate that combination treatment with an amylin analog and human recombinant leptin significantly decreases not only body weight but also insulin levels in obese subjects.73
Importantly, individuals with evidence of more severe leptin resistance will likely require greater medical and social support measures to achieve and maintain substantial weight loss through lifestyle modifications such as diet and exercise. Hence, these individuals may benefit from more frequent and intensive interaction with medical providers, dieticians, and nutrition and exercise counselors to successfully lose weight and maintain weight loss.
In addition, bariatric surgery may be a consideration in the treatment of obese individuals with leptin resistance, especially for individuals with type 2 diabetes or other obesity-related morbidities recognized as indications for bariatric surgery.
In general, for obese individuals with elevated circulating leptin levels, weight loss may be one of the primary therapeutic targets. The following lifestyle recommendations and medications can be used to reduce insulin resistance and improve β-cell function, personalized to the individual patient’s clinical needs.
Lifestyle74-80 :
Limit carbohydrates (especially simple sugars and processed carbohydrates) while maintaining moderate fat intake
Weight loss (as appropriate)
Regular exercise (150 minutes/week combining cardiovascular activity at a moderate-to-vigorous pace with resistance training)
Medication choices may include:
Metformin (e.g., Glucophage®, Glumetza®)
Pioglitazone (Actos®)
Incretin mimetics (GLP-1 agonists)
DPP-4 inhibitors
Quick-release bromocriptine mesylate (Cycloset®)
Alpha-glucosidase inhibitors (acarbose)
Leptin Manager (supplement from Xymogen) – shown to reduce weight (0.55kg loss in 12 wks) and leptin levels.
References
Zhang Y, Proenca R, Maffei M, et al. Positional cloning of the mouse obese gene and its human homologue. Nature 1994;372(6505):425-432.
Frederich RC, Hamann A, Anderson S, et al. Leptin levels reflect body lipid content in mice: evidence for diet-induced resistance to leptin action. Nat Med 1995;1(12):1311-1314.
Pelleymounter MA, et al. Effects of the obese gene product on body weight regulation in ob/ob mice. Science 1995;269(5223):540-543.
Halaas JL, et al. Weight-reducing effects of the plasma protein encoded by the obese gene. Science 1995;269(5223):543-546.
Cannon B, Nedrgaard J. Brown adipose tissue: function and physiological significance. Physiol Rev 2004;84: 277-359.
Unger RH, Scherer PE. Gluttony, sloth and the metabolic syndrome: a roadmap to lipotoxicity. Trends Endocrinol Metab 2010;21(6):345-52.
Green ED, Maffei M, Braden VV, et al. The human obese (OB) gene: RNA expression pattern and mapping on the physical, cytogenetic, and genetic maps of chromosome 7. Genome Res 1995;5(1):5-12.
El-Sayed Moustafa JS, Froguel P. From obesity genetics to the future of personalized obesity therapy. Nat Rev Endocrinol 2013 9(7):402-13.
Farooqi IS, Matarese G, Lord GM, et al. Beneficial effects of leptin on obesity, T cell hyporesponsiveness, and neuroendocrine/metabolic dysfunction of human congenital leptin deficiency. J Clin Invest 2002;110:1093-103.
Oral EA, Simha V, Ruiz E, et al. Leptin-replacement therapy for lipodystrophy. N Engl J Med 2002;346(8):570-8.
Chan JL, Lutz K, Cochran E, et al. Clinical effects of long-term metreleptin treatment in patients with lipodystrophy. Endocr Pract 2011;17(6):922-32.
Firoenza CG, Chou SH, Mantzoros CS. Lipodystrophy: pathophysiology and advances in treatment. Nat Rev Endocrinol 2011;7(3):137-150.
Capeau J, Magré J, Lascols O, et al. Diseases of adipose tissue: genetic and acquired lipodystrophies. Biochem Soc Trans 2005;33(5):1073-7.
Zelissen PM, Stenlof K, Lean ME, et al. Effect of three treatment schedules of recombinant methionyl human leptin on body weight in obese adults: a randomized, placebo-controlled trial. Diabetes Obes Metab 2005;7(6):755-61.
Heymsfield SB, Greenberg AS, Fujioka K, et al. Recombinant leptin for weight loss in obese and lean adults: a randomized, controlled, dose-escalation trial. JAMA 1999;282(16):1568-75.
Schwartz MW, Porte D Jr. Diabetes, obesity, and the brain. Science 2005;307:375-379.
Lustig RH. Childhood obesity: behavioral aberration or biochemical drive? Reinterpreting the First Law of Thermodynamics. Nat Clin Pract Endocrinol Metab 2006;2(8):447-58.
Obici S, Rossetti L. Minireview: nutrient sensing and the regulation of insulin action and energy balance. Endocrinology 2003;144(12):5172-8.
Ahima RS, et al. Role of leptin in the neuroendocrine response to fasting. Nature 1996;382(6588):250-252.
Shah NR, Braverman ER. Measuring adiposity in patients: the utility of body mass index (BMI), percent body fat, and leptin. PLoS One 2012;7(4):e33308.
Ricci MR, Fried SK. Isoproterenol decreases leptin expression in adipose tissue of obese humans. Obes Res 1999;7(3):233-40.
Ricci MR, Lee MJ, Russell CD, et al. Isoproterenol decreases leptin release from rat and human adipose tissue through posttranscriptional mechanisms. Am J Physiol Endocrinol Metab 2005;288(4):E798-804.
Fulda S, Linseisen J, Wolfram G, et al. Leptin plasma levels in the general population: influence of age, gender, body weight and medicalb history. Protein Pept Lett 2010;17(11):1436-40.
Gautron L, Elmquist JK. Sixteen years and counting: an update on leptin in energy balance. J Clin Invest 2011;121(6):2087-2093.
Morton JM, Schwartz MW. Leptin and the central nervous system control of glucose metabolism. Physiol Rev 2011;91:380-411.
Wabitsch M, Jensen PB, Blum WF, et al. Insulin and cortisol promote leptin production in cultured human fat cells. Diabetes 1996;45(10):1435–1438.
Scarpace PJ, Zhang Y. Leptin resistance: a prediposing factor for diet-induced obesity. Am J Physiol Regul Integr Comp Physiol 2009;296:R493–R500.
Martin SS, Qasim A, Reilly MP. Leptin resistance. A possible interface of inflammation and metabolism in obesity-related cardiovascular disease. JACC 2008;52(15):1201-1210.
Mantzoros CS, Magkos F, Brinkoetter M, et al. Leptin in human physiology and pathophysiology. Am J Physiol Endocrinol Metab 2011;301:E567-E584.
Oswal A, Giles Y. Leptin and the control of body weight: A review of its diverse central targets, signaling mechanisms, and role in the pathogenesis of obesity. Obesity 2010;18:221-229.
Bergman RN, Ader M. Atypical antipsychotics and glucose homeostasis. J Clin Psychiatry 2005;66:504-514.
Zaletel J, Barlovic DP, Prezelj J. Adiponectin-leptin ratio: a useful estimate of insulin resistance in patients with Type 2 diabetes. J Endocrinol Invest 2010;33(8):514e8.
Oda N, Imamura S, Fujita T, et al. The ratio of leptin to adiponectin can be used as an index of insulin resistance. Metabolism 2008;57(2):268e73.
Rasmussen-Torvik LJ, Wassel CL, Ding J, et al. Associations of body mass index and insulin resistance with leptin, adiponectin, and the leptin-to-adiponectin ratio across ethnic groups: the Multi-Ethnic Study of Atherosclerosis (MESA). Ann Epidemiol 2012;22(10):705-9.
Kappelle PJ, Dullaart RP, van Beek AP, et al. The plasma leptin/adiponectin ratio predicts first cardiovascular event in men: a prospective nested case-control study. Eur J Intern Med 2012;23(8):755-9.
Marroqui L, Gonzalez A, Neco P, et al. Role of leptin in the pancreatic β-cell: effects and signaling pathways. J Molec Endocrinol 2012;49:R9-R17.
Minokoshi Y, Kim YB, Peroni OD, et al. Leptin stimulates fatty acid oxidation by activating AMP-activating protein kinase. Nature 2002;415:339-343.
Lee YH, Magkos F, et al. Effects of leptin and adiponectin on pancreatic β-cell function. Metabolism 2011;60:1664-1672.
Kieffer TJ, Habener JF. The adipoinsular axis: effects of leptin on pancreatic beta-cells. Am J Physiol Endocrinol Metab 2000;278:E1-4.
Seufert J. Leptin effects on pancreatic beta-cell gene expression and function. Diabetes 2004;53(Suppl 1):S152-8.
Dardeno TA, Chou SH, Moon HS, et al. Leptin in human physiology and therapeutics. Front Neuroendocrinol 2010;31:377-393.
Ren J. Leptin and hyperleptinemia – from friend to foe for cardiovascular function. J Endocrinol 2004;181(1):1-10.
Fantuzzi G, Faggioni R. Leptin in the regulation of immunity, inflammation, and hematopoiesis. J Leukoc Biol 2000;68(4): 437–46.
Matarese G, Procaccini C, De Rosa V, et al. Regulatory T cells in obesity: the leptin connection. Trends Mol Med 2010;16(6):247-56.
Heiman ML, Ahima RS, Craft LS, et al. Leptin inhibition of the hypothalamic-pituitary-adrenal axis in response to stress. Endocrinology 1997;138(9):3859–3863.
Mabuchi T, Yatsuya H, Tamakoshi K. Association between serum leptin concentration and white blood cell count in middle-aged Japanese men and women. Diabetes Metab Res Rev 2005;21(5):441–447.
Chan JL, Heist K, DePaoli AM, Veldhuis JD, Mantzoros CS. The role of falling leptin levels in the neuroendocrine and metabolic adaptation to short-term starvation in healthy men. J Clin Invest 2003;111(9):1409–1421.
Harsch IA, Konturek PC, Koebnick C, et al. Leptin and ghrelin levels in patients with obstructive sleep apnoea: effect of CPAP treatment. Eur Respir J 2003;22(2): 251–257.
Seaborg E. Growing evidence links too little sleep to obesity and diabetes. Endocrine News 2007: 14–15.
Knutson KL, Spiegel K, Penev P, et al. The metabolic consequences of sleep deprivation. Sleep Med Rev 2007;11(3):163–178.
Hafner S, Baumert J, Lacriz ME, et al. Sleep disturbances and depressed mood: a harmful combination associated with increased leptin levels in women with normal weight. Biol Psychol 2012; 89(1):163-9.
de Salles BF, Simão R, Fleck SJ, et al. Effects of resistance training on cytokines. Int J Sports Med 2010;31(7):441–450.
Otsuka R, Yatsuya H, Tamakoshi K, et al. Perceived psychological stress and serum leptin concentrations in Japanese men. Obesity (Silver Spring) 2006;14(10):1832–1838.
Ahima RS, Flier JS. Leptin. Annu Rev Physiol 2000;62:413–437.
Mantzuros CS. Leptin in renal failure. J Ren Nutr 1999;9:122-125.
Asimakopoulos B, Milousis A, Gioka T, et al. Serum pattern of circulating adipokines throughout the physiological menstrual cycle. Endocr J 2009;56(3):425-33.
Ben Ali S, Jemaa R, Ftouhi B, et al. Relationship of plasma leptin and adiponectin concentrations with menopausal status in Tunisian women. Cytokine 2011;56(2):338-42.
Sweeney G. Cardiovascular effects of leptin. Nat Rev Cardiol 2010;7:22-29.
Abel ED, Sweeney G. Modulation of the cardiovascular system by leptin. Biochimie 2012;94:2097-2103.
Reilly MP, Iqbal N, Schutta M, et al. Plasma leptin levels are associated with coronary atherosclerosis in type 2 diabetes. J Clin Endocrinol Metab 2004;89(8):3872-8.
Lee Y, Naseem RH, Duplomb L, et al. Hyperleptinemia prevents lipotoxic cardiomyopathy in acyl CoA synthase transgenic mice. Proc Natl Acad Sci USA 2004;101(37):13624-9.
Smith CC, Yellon DM. Adipocytokines, cardiovascular pathophysiology and myocardial protection. Pharmacol Ther 2011;129(2):206-19.
Söderberg S, Ahrén B, Jansson JH, et al. Leptin is associated with increased risk of myocardial infarction. J Intern Med 1999;246(4):409-18.
Beltowski J. Leptin and atherosclerosis. Atherosclerosis 2006;189(1):47-60
Lavie CJ, Milani RV, Ventura HO. Obesity and cardiovascular disease: risk factor, paradox, and impact of weight loss. J Am Coll Cardiol 2009;53:1925-32.
Oral EA, et al. Leptin-replacement therapy for lipodystrophy. N Engl J Med 2002;346(8):570-578.
Licinio J, et al. Phenotypic effects of leptin replacement on morbid obesity, diabetes mellitus, hypogonadism, and behavior in leptindeficient adults. Proc Natl Acad Sci USA 2004;101(13)4531-4536.
Kelesidis T, Kelesidis I, Chou S, et al. Narrative review: the role of leptin in human physiology: emerging clinical applications. Ann Intern Med 2010;152:93-100.
Friedman JM, Halaas JL. Leptin and the regulation of body weight in mammals. Nature 1998;395(6704):763–770.
Heymsfield SB, Greenberg AS, Fujioka K, et al. Recombinant leptin for weight loss in obese and lean adults: a randomized, controlled, dose-escalation trial. JAMA 1999;282(16):1568–1575.
Lo KM, Zhang J, Sun Y, et al. Engineering a pharmacologically superior form of leptin for the treatment of obesity. Protein Eng Des Sel 2005;18(1):1–10.
Farooqi IS, Matarese G, Lord GM, et al. Beneficial effects of leptin on obesity, T cell hyporesponsiveness, and neuroendocrine/metabolic dysfunction of human congenital leptin deficiency. J Clin Invest 2002;110:1093-103.
Ravussin E, Smith SR, Mitchell JA, et al. Enhanced weight loss with pramlintide/metreleptin: an integrated neurohormonal approach to obesity pharmacotherapy. Obesity (Silver Spring) 2009;17:1736-43.
Mirza NM, Palmer MG, Sinclair KB, et al. Effects of a low glycemic load or a low-fat dietary intervention on body weight in obese Hispanic American children and adolescents: a randomized controlled trial. Am J Clin Nutr 2013;97:276-285.
Yki-Järvinen H. Nutritional modulation of nonalcoholic fatty liver disease and insulin resistance: human data. Curr Opin Clin Nutr Metab Care 2010;13(6):709-14.
Bradley U, Spence M, Courtney CH, et al. Low-fat versus low-carbohydrate weight reduction diets: effects on weight loss, insulin resistance, and cardiovascular risk: a randomized control trial. Diabetes 2009;58(12):2741-8.
Ross R, Janssen I, Dawson J, et al. Exercise-induced reduction in obesity and insulin resistance in women: a randomized controlled trial. Obes Res 2004;12(5):789-798.
O’Hagan C, De Vito G, Boreham CA. Exercise prescription in the treatment of type 2 diabetes mellitus: current practices, existing guidelines and future directions. Sports Med 2013;43:39-49.
Davidson LE, Hudson R, Kilpatrick K, et al. Effects of exercise modality on insulin resistance and functional limitation in older adults: a randomized controlled trial. Arch Intern Med 2009;169(2):122-131.
Williams MA, Haskell WL, et al. American Heart Association Council on Clinical Cardiology; American Heart Association Council on Nutrition, Physical Activity, and Metabolism. Resistance exercise in individuals with and without cardiovascular disease: 2007 update: a scientific statement from the American Heart Association Council on Clinical Cardiology and Council on Nutrition, Physical Activity, and Metabolism. Circulation 2007;116:572-584.
Aguilar RB. Evaluating treatment algorithms for the management of patients with type 2 diabetes mellitus: a perspective on the definition of treatment success. Clin Ther 2011;33(4):408-24.
Moore EM, Mander AG, Ames A, et al. Increased risk of cognitive impairment in patients with diabetes is associated with metformin. Diabetes Care 2013;36(10):2981-7.
We measure Myeloperoxidase (MPO) as part of our Functional Medicine health evaluation. It is a part of our “full panel” lab assessment. High levels of myeloperoxidase correlate with an increased risk of cardiovascular disease.
Myeloperoxidase (MPO) is an enzyme derived from white blood cells (Leukocytes). It plays a role in the inflammatory response and helps to kill invading pathogens by generating reactive oxidants. Myeloperoxidase (MPO) is released from macrophages when the arterial wall is inflamed or damaged.
The purpose of the immune system is to protect us from the invading organisms and pathogens. Myeloperoxidase is a critical part of this system.
However, cardiovascular disease is not really a disease. It is a process. It is a condition where the body is responding to one of over 400 ‘insults’ which are threatening (or at least identified as such) our bodies. These insults are toxic and cause the immune system to fire up. Myeloperoxidase is both a marker that the immune system is activated and an actual contributor to the cardiovascular disease process.
These appropriate responses become exaggerated and chronic resulting in activation of the ‘3 finite responses’ and subsequent cardiovascular disease.
Myeloperoxidase (MPO) has several potential effects that increase the development of plaque such as:
Nitric oxide (NO) produced by endothelial nitric oxide synthase (NOS) is a powerful vasodilator and as such plays a critical role in the regulation of vascular tone. Additionally, NO suppresses binding of circulating cells to the endothelium and inhibits proliferation of smooth-muscle cells in the vascular wall. Taken together, these findings indicate that NO is a critical element in vascular homeostasis, and consequently insufficient production and/or increased scavenging of NO may impair vascular function and accelerate atherosclerosis.
There are strong indications that MPO, by several mechanisms, may reduce the bioavailability of NO.
NO serves as a substrate for peroxidases, and MPO may thus serve as a catalytic sink for NO.6,7
Scavenging of NO by MPO-derived reactive substances may further reduce the bioavailability of NO.
Hypochlorous acid can react with nitrogen atoms of the NOS substrate arginine to produce chlorinated arginine species that are inhibitors of all isoforms of NOS and have been shown to impair endothelium-dependent relaxation of rat aortic rings.8
It has been demonstrated that hypochlorous acid is a potent inducer of uncoupling of endothelial NOS, thereby turning NOS into a superoxide-producing enzyme.9
Although the relative impact of these mechanisms is currently unknown, it is clear that MPO, by catalytic as well as non-catalytic processes, depletes NO in the vascular wall.
Interpretation
The clinical utility of MPO testing is well documented in more than 100 manuscripts published peer-reviewed journals, including the New England Journal of Medicine, the Journal of the American College of Cardiology, the American Journal of Cardiology, Circulation, JAMA, and others.
Specifically, MPO testing has proven clinically useful in primary prevention, secondary prevention, and heart failure settings, allowing physicians to appropriately classify various types of patients into risk categories in order to provide optimal lifestyle modifications or implement treatment strategies.
Primary Prevention Studies
Various studies have documented that increasing MPO levels predict increasing risk in various cohorts of individuals. In primary prevention studies, elevated MPO levels are a strong predictor of endothelial dysfunction in healthy individuals independent of Framingham risk score, prevalent cardiovascular disease, cardiovascular medications, and CRP.10
EPIC-Norfolk Prospective Population Study
The EPIC-Norfolk Prospective Population study demonstrated that elevated MPO levels are associated with the future risk of developing coronary artery disease (CAD) in healthy individuals even beyond traditional biomarkers, including LDL, HDL, and CRP.11
EISNER Study
The EISNER study demonstrated that elevated MPO levels are associated with increased risk of CVD events (MI, stroke, or death) in healthy individuals.12
Cardiovascular health Study
The Cardiovascular Health study demonstrated that elevated MPO levels are associated with the development of heart failure in healthy individuals.13
Secondary Prevention Studies
In secondary prevention studies, a single baseline MPO measurement independently predicts the risk for major adverse cardiac events in individuals with chest pain, but persistently negative for troponin T.14
The ADEPT study demonstrated that elevated MPO levels are associated with an increased likelihood of more advanced heart failure and predict long-term clinical outcomes in individuals with heart failure.
Treatment
Short-term rosuvastatin reduces inflammation in individuals with heart failure by reducing MPO levels. Animal studies have also demonstrated that acetaminophen has considerable potential as a therapeutic inhibitor of MPO-mediated tissue damage,16 and niacin inhibits vascular inflammation and prevents endothelial dysfunction by inhibiting MPO accumulation.17
References
Klebanoff SJ, Waltersdorph AM, Rosen H. Antimicrobial activity of myeloperoxidase. Methods Enzymol 1984;105:399-403.
Tavora FR, Ripple M, Li L, et al. Monocytes and neutrophils expressing myeloperoxidase occur in fibrous caps and thrombi in unstable coronary plaques. BMC Cardiovasc Disord 2009;9:27.
Eiserich JP, Baldus S, Brennan ML, et al. Myeloperoxidase, a leukocyte-derived vascular NO oxidase. Science 2002;296(5577):2391-4.
Podrez EA, Schmitt D, Hoff HF, et al. Myeloperoxidase-generated reactive nitrogen species convert LDL into an atherogenic form in vitro. J Clin Invest 1999;103(11):1547-60.
Zheng L, Nukuna B, Brennan ML, et al. Apolipoprotein A-I is a selective target for myeloperoxidase-catalyzed oxidation and functional impairment in subjects with cardiovascular disease. J Clin Invest 2004;114(4):529-41.
Baldus S, Heitzer T, Eiserich JP, et al. Myeloperoxidase enhances nitric oxide catabolism during myocardial ischemia and reperfusion. Free Radic Biol Med 2004;37(6):902-11.
Abu-Soud HM, Hazen SL. Nitric oxide is a physiological substrate for mammalian peroxidases. J Biol Chem 2000;275(48):37524-32.
Yang J, Ji R, Cheng Y, et al. L-arginine chlorination results in the formation of a nonselective nitric-oxide synthase inhibitor. J Pharmacol Exp Ther 2006;318(3):1044-9.
Xu J, Xie Z, Reece R, et al. Uncoupling of endothelial nitric oxidase synthase by hypochlorous acid: role of NAD(P)H oxidase-derived superoxide and peroxynitrite. Arterioscler Thromb Vasc Biol 2006;26(12):2688-95.
Vita JA, Brennan ML, Gokce N, et al. Serum myeloperoxidase levels independently predict endothelial dysfunction in humans. Circulation 2004;110(9):1134-9.
Meuwese MC, Stroes ES, Hazen SL, et al. Serum myeloperoxidase levels are associated with the future risk of coronary artery disease in apparently healthy individuals: the EPIC-Norfolk Prospective Population Study. J Am Coll Cardiol 2007;50(2):159-65.
Wong ND, Gransar H, Narula J, et al. Myeloperoxidase, subclinical atherosclerosis, and cardiovascular disease events. JACC Cardiovasc Imaging 2009;2(9):1093-9.
Tang WH, Katz R, Brennan ML, et al. Usefulness of myeloperoxidase levels in healthy elderly subjects to predict risk of developing heart failure. Am J Cardiol 2009;103(9):1269-74.
Brennan ML, Penn MS, Van Lente F, et al. Prognostic value of myeloperoxidase in patients with chest pain. N Engl J Med 2003;349(17):1595-604.
Tang WH, Tong W, Troughton RW, et al. Prognostic value and echocardiographic determinants of plasma myeloperoxidase levels in chronic heart failure. J Am Coll Cardiol 2007;49(24):2364-70.
Koelsch M, Mallak R, Graham GG, et al. Acetaminophen (paracetamol) inhibits myeloperoxidase-catalyzed oxidant production and biological damage at therapeutically achievable concentrations. Biochem Pharmacol 2010;79(8):1156-64.
Wu BJ, Yan L, Charlton F, et al. Evidence that niacin inhibits acute vascular inflammation and improves endothelial dysfunction independent of changes in plasma lipids. Arterioscler Thromb Vasc Biol 2010;30(5):968-75.
When it comes to cardiovascular disease, CardiaX is incredibly important for understanding your risk of developing cardiovascular disease as well as hypertension.
Cardiovascular disease is the #1 killer of men and women in the US and in the world. Our Tulsa Functional Medicine clinic focuses on identifying the underlying cause for illness and disease as well as your individual risk for future problems.
Not only does the CardiaX gentic test help us identify a potential problem, it also helps us understand how to optimally treat it.
Consider this case:
A 44 year old black male with a history of hypertension for 20 years. He is on 4 medications (amlodipine 5mg, ramipril 10mg, indapamide 1.25mg, and metoprolol 100mg) and his blood pressure is STILL 168/102 and he has some lower extremity edema.
His labs showed a high urine aldosterone and potassium. His plasma renin activity (PRA) was low at 0.42. His endothelial function test (Endopat) was low at 1.52. His CardiaX genetics showed that he was CYP4A11 homozygote abnormal.
He was started on Amiloride 10mg per day. This is an older medication that is just not used much anymore at all.
In 8 weeks he was only taking Amiloride 10mg and amlodipine 5mg per day. He had no edema and his endothelial function (Endopat) was 1.95 (near normal). Oh, and his blood pressure was 122/84!
This is a real case and underscores how understanding your genetics and treating them appropriately can dramatically alter the course of the disease process. His CYP4A11 is a specific genetic alteration with specific implications. The ONLY medication that works in this case is amiloride.
Why YOU need a CardiaX Lab:
CardiaX is a genetics labs evaluating your genetics for 21 different Single Nucleotide Polymorphisms (SNPs). Each of these 21 SNPs were identified through research as both pertaining to cardiovascular disease or hypertension AND are modifiable. That doesn’t mean that we can change the gene itself but we CAN change the expression of the gene and reduce its impact.
Each of these genes play a role in cardiovascular disease. The case above gives an example of how knowing the genetics can change the way we treat your risk for cardiovascular disease.
It is an excellent test and EVERYONE should know their genetics and have this test read by a physician who understands the implications of these specific genes.
It is a once in a lifetime test – you’ll never have to do it again because your genetics will never change.
Who should get a CardiaX lab?
My first answer is that everyone should get it. However, more specifically, anyone who has any of the following concerns should get the CardiaX genetic evaluation:
This gene is commonly associated with increased risk of cardiovascular disease.
Aggressive early detection, prevention and risk factor control is essential.
The following heart healthy lifestyle changes are recommended to increase HDL cholesterol levels: increase intake of monounsaturated fats, daily cardiovascular exercise, fruits high in fiber, and increased intake of fatty fish high in omega-3 fatty acids. Also, eliminate sugar sweetened beverages (SSB).
aka Phosphatase & Actin Regulator 1 (PHACTR1). Mostly expressed in the brain (globus pallidus). It is a protein which regulates the reorganization of the cytoskeleton. Associated with migraines and CAD. Induces by NRP and VEGF through NRP-1 and VEGF-R1 receptors. Thus, it is thought to play a role in cell motility and vascular morphogenesis.
Early identification, prevention and risk factor control is extremely important in the context of heart disease.
Emphasize a lower fat, higher fiber diet based on whole plant sources and unrefined foods. High fiber, low-fat diets, combined with exercise, reduce the risk of Venous Thrombosis.
4q25
Excess sodium intake has been linked to hypertension in some individuals. This can increase risk for atrial fibrillation.
Consider limiting sodium intake to <1500mg/day.
To reduce risk of stroke, limit intake of saturated and trans fats, and increase intake of monounsaturated fats from high-omega-3 source fish, such as salmon.
1q25
encodes for glutamine synthase, an enzyme that converts glutamate to glutamine. This SNP is significantly associated with CHD in diabetic patients (OR 1.36) but not in patients without diabetes (OR 0.99).
This C mutation has been associated with an increased effect in diabetics.
Tight control of blood glucose is an important clinical target. Consider glutathione precursors for treatment.
Diet changes should focus on an increase in fiber and reduced intake of refined sugar.
CYP11B2
Polymorphisms in this gene control aldosterone levels.
Higher aldosterone leads to higher blood pressure.
Spironolactone is considered the best treatment option in these patients (ACEI or ARB), especially in resistant hypertensive patients. Aldosterone breakthrough on ARB and ACEI may be more common with the TT allele.
TT variant results in highest aldosterone levels followed by CT, and then CC.
Low sodium, heart healthy diets such as DASH and Mediterranean and selective angiotensin receptor antagonists have been shown to help reduce hypertension.
CYP4F2
Myocardial infarction, or heart attack, occurs due to inadequate blood flow or lack of oxygen which damages heart muscle. Avoiding smoking, reducing blood cholesterol and increasing physical activity can all help in maintaining good heart health. The DASH diet is recommend as it has been shown to reduce risk of heart attack
Myocardial infarction, or heart attack, occurs due to inadequate blood flow or lack of oxygen which damages heart muscle.
Avoiding smoking, reducing blood cholesterol and increasing physical activity can all help in maintaining good heart health.
The DASH diet is recommend as it has been shown to reduce risk of heart attack
ApoC3
It damages your HDL and makes it dysfunctional and the LDL more atherogenic. It is an independent risk factor for CVD. The ratio of HDL/ApoC3 or VLDL/ApoC3 is a better CHD risk predictor than ApoA or ApoB. It antagonizes ApoE and inhibits clearance of TRL from the circulation. It increases TG and sdLDL. It inhibits Lipoprotein Lipase and clearance of LDL. It promotes vascular inflammation, stimulates NfKb, increases CAMs, activates monocytes and endothelial cells. High responder to endotoxin. Role in pancreatic B cell biology and DM1.
Lowered by fibrates (30%), statins (20%), testosterone, low carbohydrate diets, and weight loss.
Reducing lipid levels (Total-C and LDL-C) are the goal for treatments of this condition.
Exercise, red wine and increased intake of monounsaturated fatty acids can help increase HDL levels, which will help reduce LDL-C.
Exercise >150 minutes per week.
Omega 3 supplementation has been shown to improve HDL. Whole food, plant based, high fiber diets have also been shown to reduce LDL-C.
Alternatively, cholesterol lowering medication can be considered.
COMT
Use of vitamin E and aspirin should be based on COMT polymorphisms.
Individuals who are homozygous for the enzyme’s high-activity valine form, the “val/vals,” have been shown to have lower levels of catecholamines compared to individuals who are homozygous for the enzyme’s low-activity methionine form; the “met/mets,” the val/met heterozygotes are in between.
Give aspirin or vitamin E to met/met (A/A), but neither to val/met(G/A) or val/val (G/G).
ACE I/D
Blood pressure is controlled by the renin-angiotensin system (RAS) which is directly affected by the ACE I/D polymorphism.
Variant D carriers make more ACE protein which results in a more active RAS system than that of variant I carriers. Variant D carriers will have a heightened sensitivity to sodium intake and a higher risk for hypertension with increased sodium intake.
Reducing sodium intake is recommended.
Avoiding smoking, reducing blood cholesterol and increasing physical activity can all help in maintaining good heart health.
The DASH diet (Dietary Approaches to Stop Hypertension) is also recommended which has been shown to reduce heart attack risk by 18%.
ApoE
APOE genotype contributes to the inter-individual variability observed in the metabolic response to an Omega-3 PUFA supplementation, especially serum lipids and glucose.
N3 PUFA supplementation was associated with a decrease of plasma triglyceride levels (p = 0.0002) as well as with an increase of fasting glucose (FG) levels but within normal levels(p = 0.02) in all phenotypes
APOE genotype was associated with increased FG (p = 0.001) and decreased C-reactive protein levels (p = 0.03) after supplementation.
Total-C, LDL-C, and Apo-B levels were higher in subjects carrying the APOE4 allele, intermediate in homozygotes for the APOE3 allele, and lower in carriers of the APOE2 allele.
MTHFR
Methylation supplementation is recommended for individuals who carry the mutations of the MTHFR genes.
Mutations in the MTHFR gene lead to accumulation of homocysteine in the body which increases risk for cardiovascular disease.
The most important nutrients that help lower homocysteine levels are folate, vitamins B12, B6 and B2, zinc and trimethylglycine (TMG).
CYP1A2
Caffeine is exclusively metabolized by CYP1A2 to paraxanthine, theobromine and theophylline.
Avoid caffeine if you are a slow metabolizer.
Polyphenols, chlorogenic acid and dihydro-caffeic acid increase eNOS and lower blood pressure.
Dietary changes such as DASH diet or Mediterranean diet are recommended for heart health and normal blood pressure.
Increasing potassium intake and reducing sodium intake have also been shown to lower blood pressure
SCARB1
Variant of SCARB1 changes a hepatic receptor protein from glycine to serine. Increased blood levels of HDL due to inability of HDL to attach to hepatic receptor for break down, disposal and recirculation. The HDL is not protective (dysfunctional). Increased risk of CHD by 49% in black males and 24% higher in white males.
Frequency: Chinese (3%), Blacks (8%), Latinos/whites (12%)
Because dysfunctional HDL does not appropriately assist in reverse cholesterol transport, avoid high saturated and trans fat foods to reduce Total-C level.
Eating fish high in omega 3 fatty acids have shown to decrease triglycerides and LDL cholesterol, as well as improve blood vessel elasticity, which reduces the risk for blood clots.
Oils with a higher polyunsaturated fat content, such as avocado, olive or safflower, contain more omega-6 fatty acids have been shown to reduce LDL cholesterol levels
NOS3
The 3 mutations in NOS3 gene lead to decreased production of Nitrous oxide or impede its travel to the cell membrane. Nitric oxide precursors can be used as supplements to compensate for these mutations.
Alternatively, exercise helps vascular endothelium release nitrous oxide, which relaxes arteries and increases blood flow.
Plant foods, particularly beets and leafy greens like kale, Swiss chard, arugula, and spinach, are rich in dietary nitrates and nitrites—compounds that stimulate the production of Nitrous oxide in the body.
ADR-B2
B2 adrenergic receptor. DASH diet increases PRA & Aldosterone levels in response to decreases in BP which can counteract the BP lowering effect of the diet. Adding an ACEi, ARB, or DRI improves BP response to the DASH diet in GG genotype due to the reflex increase in PRA.
Dietary interventions such as DASH diet or Mediterranean diet are recommended for reducing blood pressure.
A whole foods plant based diet is high in dietary fiber which can help reduce blood pressure.
High fiber, low-fat diets, combined with exercise, reduce the risk of Venous Thrombosis.
Corin
a serine protease that is the key enzyme in the biosynthesis of ANP and BNP which regulate salt and water balance, intravascular volume, and blood pressure. Corin is reduced in patients with CHF. The SNP is more common in blacks and may account for the increase in salt sensitive HTN & CVD.
Corin is a serine protease which is a key enzyme in the bio-synthesis of atrial natriuretic peptide (ANP) and brain natriuretic peptide (BNP) which regulate sodium and fluid balance, intravascular volume and blood pressure.
Mutations in corin genes lead to increased risk for sodium-sensitive hypertension.
Maintaining a healthy weight is important to avoid hypertension and other heart conditions.
Regular exercise, combined with a heart healthy diet rich in fiber, can help control blood pressure.
Reducing sodium intake and increasing potassium intake from vegetables has been shown to reduce blood pressure.
Pregnant women with risk for pre-eclampsia should consult with their physician and dietitian
GSHPx
Polymorphisms in glutathione peroxidase have been shown to increase the risk of cardiovascular disease due to decreased GSH-Px enzyme activity.
Supplementation of selenium and glutathione is recommended.
Food and specific nutrients as listed in the supplementary form can also be considered to reduce hypertension, CHD and MI risk.
Apo A1
Polymorphism in this gene is associated with Dyslipidemia due to impaired reverse cholestrol transport.
Reduced intake of high saturated and trans fat foods increases HDL-C and reduces LDL-C. A whole foods plant based diet, low in unhealthy fats, may help improve lipid levels. Exercise >150 minutes per week, may increase HDL levels. Higher HDL levels help remove bad cholesterol from the body. Emphasize nuts, fish and other foods containing omega-3 fatty acids to improve the ratio of LDL cholesterol to HDL cholesterol. Moderate use of alcohol has been linked with higher levels of HDL in some individuals.
Apo A2
Reduced intake of high saturated and trans fat foods increases HDL-C and reduces LDL-C.
A whole foods plant based diet, low in unhealthy fats, may help improve lipid levels. Exercise >150 minutes per week, may increase HDL levels. Higher HDL levels help remove bad cholesterol from the body.
Emphasize nuts, fish and other foods containing omega-3 fatty acids to improve the ratio of LDL cholesterol to HDL cholesterol.
Moderate use of alcohol has been linked with higher levels of HDL in some individuals.
CYP 4A11
One of the CYP450 enzymes. Hydroxylates MCFAa such as laurate and myristate. Metabolizes AA to 20-hydroxyeicosatetraenoic acid (20-HETE) by an Omega oxidation Rxn. 20-HETE regulates blood flow, vascularization, BP, and kidney tubule absorption of ions in rodents and possibly humans.
Amiloride is used with other diuretics as listed in the supplementary form to treat hypertension, heart failure, or extra fluid in the body (edema).
Amiloride also helps to treat or prevent low blood potassium levels caused by other diuretics.
Lowering high blood pressure helps prevent strokes, heart attacks, and kidney problems.
AGTR1
AGTR1 polymorphisms directly affect the RAAS system which controls blood pressure, depending on dietary potassium intake.
ACE inhibitors and angiotensin receptor inhibitors can be used to reduce high blood pressure and risk for heart failure.
Lowering sodium and increasing potassium intake has been shown to help reduce blood pressure.
References
Shen GQ1, Rao S, Martinelli N, Li L, Olivieri O, Corrocher R, Abdullah KG, Hazen SL, Smith J, Barnard J, Plow EF, Girelli D, Wang QK.Association between four SNPs on chromosome 9p21 and myocardial infarction is replicated in an Italian population. Genome-wide single nucleotide polymorphism (SNP) association studies recently identified four SNPs (rs10757274, rs2383206, rs2383207, and rs10757278) on chromosome 9p21 were associated with myocardial infarction (MI) with odd ratio of 1.24, 1.31, 1.26, and 1.28.
Helgadottir A1, Thorleifsson G, Magnusson KP, Grétarsdottir S, Steinthorsdottir V, Manolescu A, Jones GT, Rinkel GJ, Blankensteijn JD, Ronkainen A, Jääskeläinen JE, Kyo Y, Lenk GM, Sakalihasan N, Kostulas K, Gottsäter A, Flex A, Stefansson H, Hansen T, Andersen G, Weinsheimer S, Borch-Johnsen K, Jorgensen T, Shah SH, Quyyumi AA, Granger CB, Reilly MP, Austin H, Levey AI, Vaccarino V, Palsdottir E, Walters GB, Jonsdottir T, Snorradottir S, Magnusdottir D, Gudmundsson G, Ferrell RE, Sveinbjornsdottir S, Hernesniemi J, Niemelä M, Limet R, Andersen K, Sigurdsson G, Benediktsson R, Verhoeven EL, Teijink JA, Grobbee DE, Rader DJ, Collier DA, Pedersen O, Pola R, Hillert J, Lindblad B, Valdimarsson EM, Magnadottir HB, Wijmenga C, Tromp G, Baas AF, Ruigrok YM, van Rij AM, Kuivaniemi H, Powell JT, Matthiasson SE, Gulcher JR, Thorgeirsson G, Kong A, Thorsteinsdottir U, Stefansson K.The same sequence variant on 9p21 associates with myocardial infarction, abdominal aortic aneurysm and intracranial aneurysm. Study population included 16732 controls, 2836 individuals diagnosed with Abdominal Aortic Aneurysm, Results indicate that rs10757278-G is associated with Abdominal Aortic Aneurysm has an odd ratio of 1.31.
We are a Functional Medicine clinic and we are constantly seeking to identify and treat the underlying cause for disease. Cardiovascular disease is the #1 killer in the world so it is a major consideration in our Tulsa, Oklahoma Functional Medicine clinic.
This post focuses on at what we are looking in regards to cholesterol and lipid labs as well as what to do about them. Hopefully, this will help you understand why we care about each of these topics and why we are recommending what we recommend.
The recommendations for treatment are only suggestions and it isn’t necessary to take every one of them. Patients in our Functional Medicine Tulsa clinic will get specific, directed recommendations based on the entirety of their labs and evaluation.
I often hear people talk about their cholesterol and even use it as a metric for whether or not they are healthy. However, “cholesterol” doesn’t cause cardiovascular disease.
Cholesterol is simply an essential substance for your health. It is the backbone of Vitamin D, sex hormones (testosterone, estrogen, progesterone, aldosterone, cortisol, etc), bile, myelinated structures of the brain and central nervous system, and cell membrane fluidity. You MUST have cholesterol.
But… cholesterol is a fatty type substance and doesn’t dissolve it water (blood) so it has to have a carrier. Enter LDL.
LDL
Low-Density Lipoprotein (LDL) is a molecule consisting of triglycerides, proteins, cholesterol, and phospholipids. Notice that this molecule is NOT just cholesterol. When your doctor checks your cholesterol, they are actually checking your lipoproteins.
Most people refer to this particle as the “bad” cholesterol. It isn’t bad. It is essential to life and it DOESN’T cause cardiovascular disease, heart attacks, or plaques in your arteries.
LDL is a normal, natural molecule manufactured by your body and is not harmful or detrimental (with some exceptions in extreme situations) in its native form. However, it can be altered by a number of different mechanisms. The altered LDL IS atherogenic and DOES cause cardiovascular disease.
So then, why do many doctors tell you that you have to get your LDL down? And why does the medical literature show some benefit with decreasing LDL?
It isn’t because LDL CAUSES cardiovascular disease. The traditional medical approach would make you think that but a Functional Medicine approach seeks to understand the root causes and LDL is not the root cause. But… you do have to have LDL in order to make plaque in your arteries.
Think of LDL as the building block for plaque. If you want to build a wall, you have to have bricks. No bricks, no wall. But, a pile of bricks doesn’t make a wall. Something has to put it together. The combination of inflammation, oxidative stress, and vascular immune dysfunction are the mechanisms that put the altered LDL molecules (the bricks) together to form plaque.
Another analogy I use is to think of a bon fire. In order to have a bon fire, you have to have sticks and logs arranged into a bon fire structure. You can put all the sticks and logs you want on the pile but without a spark or a flame you’ll never actually have a bon fire.
Berberine – 500mg 2-3 times daily. This is a natural PCSK9 inhibitor.
LDL-P
When you have your LDL measured they are measuring the weight of LDL in a given volume of blood. It is like saying “you have a ton of bricks” in a truck. It is measured in milligrams per deciliter (mg/dL). LDL-P is the measurement of LDL particle number. It tells you how many bricks are in the truck.
When you understand the process of atherogenesis (the formation of plaques in the arteries) then it makes absolute sense WHY the number of these particles matter. LDL particle number is what drives the risk of CVD. Also, when your LDL-P numbers are low, sdLDL (see below) becomes less of an issue. Again, it makes sense when you understand how the blood vessels create plaques. The video below should give you an idea of how the process works.
As mentioned in the video above, sdLDL gets through the cracks in the endothelial wall easier as it is a smaller LDL particle. Part of the problem is that this sdLDL doesn’t attach to its receptor very well so it doesn’t get taken out of circulation as it should. Thus, it floats around longer.
The smaller, denser particles get through the cracks in the endothelium and get stuck in the sub-endothelial layer. These particles are highly susceptible to oxidation. There is more information on the alteration of LDL below but the oxidation of LDL is extremely bad. Since these particles are more susceptible to oxidation, sdLDL increases the inflammatory process and predisposes to higher risk of cardiovascular disease.
If LDL-P is elevated then sdLDL is the primary driving factor for cardiovascular disease. However, once the LDL-P is optimal (<700) then sdLDL is no longer a factor.
How to increase the size of your LDL and reduce sdLDL:
LDL can be altered in a number of ways such as glycation (as is the case with diabetes and elevated blood sugar), inflammation, and oxidation. Through oxidative processes (which are bad by the way) your LDL molecules become altered and creates an oxidized LDL (oxLDL).
This altered LDL particle is recognized by the immune system as abnormal or foreign. In fact, the pattern recognition receptors in your immune system identify the oxLDL as a threat in the exact same way that it identifies E. coli as a threat. That means that your body can’t differentiate between oxLDL and E. coli, an infection.
The difference between your body fighting oxLDL and E. coli is that when your body fights an infection, like E. coli, there is a finite number of the bacteria and it will usually get control of it and begin to eliminate it. The problem is that your body continues to produced oxidized LDL and continually stimulates the inflammatory process. Your body can’t ever get ahead.
Your immune system is doing what it is supposed to do. It is responding appropriately to a specific threat. However, the responses get exaggerated and out of control resulting in damage.
oxLDL is BAD stuff and tells us that there is a major problem. We want the oxLDL levels as low as we can get them. The more oxLDL you have the more inflammation it causes. That is a BAD thing!!
How to fix your oxLDL:
Green Tea – Green Tea Extract 1 capsule twice daily. Some people will need 2 capsules twice daily. Of course, you can simply drink green tea but it will take 2-3 quarts per day in order to get enough of the EGCG.
As mentioned above, LDL can be altered in other ways as well. Glycation is probably the greatest threat and you can inhibit this process by supplementing with:
We usually refer to this one as “Lp little a.” Lp(a) is a special type of LDL particle that has a highly glycated apolipoprotein(a) (aka Apo(a)) that is bonded to ApoB100 of the LDL particle. The apolipoprotein(a) is attached to ApoB100 by a single disulfide bond. The Apo(a) is comprised of a protease domain and a series of peptide kringles (kringle repeats).
Lp(a) does not bind to the LDL receptor and it is cleared by the kidney and the liver. Some labs measure Lp(a) mass but the Lp(a)-P (particle number) correlates better with the risk of cardiovascular disease. Cardiovascular disease risk is increase 1.5-3 times if there is elevated Lp(a). Lp(a) is the “Hidden Risk” in relation to lipids for cardiovascular disease.
Basically, Lp(a) interferes with tPa (tissue plasminogen activator) which breaks down clots. Since Lp(a) interferes with it, it doesn’t break down the clots and you end up having worsening clots. That is a bad thing, especially in the artery and especially in the presence of unstable plaques in the arteries.
Elevated Lp(a) is an independent risk factor for cardiovascular disease, heart attacks, strokes, peripheral vascular disease, and blood clots (DVT). There is a linear, increased risk of these things. The higher the Lp(a) (starting at a level of 25 mg/dL) the higher the risk. Lp(a) is probably the biggest contributor to the Coronary Heart Disease Gap.
I’ve mentioned oxidized LDL and discussed its problems above. Another oxidized particle that causes a problem is oxidized phospholipid (oxPL). Lp(a) is a major carrier of these pro-inflammatory oxidized phospholipids.
Also, if you’ve had a stent in one of your coronary arteries you increase re-stenosis (your stent closing back up) 2% for every mg/dL of Lp(a). This is the case even if your other lipid levels (cholesterol levels) reach target levels.[1]
Statins actually increase Lp(a) so you want to avoid them if your Lp(a) is a problem. Trans fats increase Lp(a) as well.
The target for Lp(a) is <30 mg/dL
How to decrease your Lp(a)
Niacin – the response is dose related. 2 grams per day decreases Lp(a) 21-40%. Start with 500mg once daily. After 2-4 weeks add a 2nd tablet each day. You can try taking them together or apart, it doesn’t matter. But the way you take it may increase or decrease the flushing you may get.
Flax Seeds – 1 cup per day. These may decrease Lp(a)
CarniteX 2 capsules 2-3 times daily (8-21% reduction in Lp(a))
Vitamin C: It is important to note that Vitamin C does not significantly decrease the Lp(a) levels. Rather, it protects the artery from the effects of the Lp(a). Think of it as a bullet proof vest for the artery.
10,000mg daily (27% decrease). You’ll have to divide this up as it can cause diarrhea. Take it along with D-ribose, Proline 500mg, and Lysine 1000mg (Linus Pauling protocol).
Vitamin C IV twice weekly
Berberine 500mg 2-3 times daily. Berberine is a natural PCSK9 inhibitor.
Sex hormones (estrogen & testosterone). Postmenopausal women have a 30% increased Lp(a)
Thyroid hormone
Aspirin 81mg (81% decrease)
Reduce IL-6 and inflammation
Exercise
HDL
High-density Lipoprotein (HDL) is an interesting molecule. For years, I thought that this was a major protector against cardiovascular disease. Low levels of HDL seemed to correlate with higher risk of cardiovascular disease. Also, the National Cholesterol Education Program (NCEP) stated that if your HDL was >60 mg/dL then it removed one of your other risk factors for cardiovascular disease. That sounded like a good thing to me.
Over the years, there has been a change in how we think about HDL. HDL has an important, protective function. At least it should. However, it has to be functional. If it isn’t functional then it isn’t protecting you.
Low levels of HDL suggest an increased risk of cardiovascular disease. High levels of HDL may be a red flag that it is non-functional.
When you have your HDL level measured you are actually measuring the balance of what is being produced and what is being cleared. HDL is supposed to bring cholesterol, among other things, back to the liver. High HDL could mean enhanced production of mature HDL (good) or reduced loss of lipid cargo (bad). Low HDL could mean increased loss of cargo (good) or reduced peripheral cholesterol collection (not good).
HDL is involved in Reverse Cholesterol Transport (RCT). This means that HDL picks up cholesterol (among other things) and transports it back to the liver. HDL and ApoA1 levels only account for 40% of Reverse Cholesterol Transport, also known as cholesterol efflux capacity (CEC). The remainder is due to the actual functionality of the HDL as explained above. In fact, there is a 30% increase in CVD for every standard deviation decrease in cholesterol efflux capacity.
Decreases in CEC may help explain the coronary heart disease gap in addition to Lp(a), even when LDL and LDL-P are at goal. HDL levels are strongly associated with the recovery of insulin sensitivity during the acute phase of MI and improves morbidity and mortality.
The target for HDL is: to have good functionality!
Wogonin (component of Scutellaria baicalensis Georgi extracts)
Alpha Linolenic Acid (ALA)
CoQ10
Phospatidyl Serine
Myeloperoxidase (MPO)
Myeloperoxidase is a marker of inflammation and oxidative stress. It is an enzyme produced by white blood cells that catalyzes the conversion of chloride and hydrogen peroxide to hypochlorite. MPO is primarily anti-infective but it cross reacts with ApoA1 (one of the proteins on the HDL molecule).
MPO inhibits and oxidizes ApoA1 and HDL making them dysfunctional. This reduces HDLs ability to effective transport cholesterol (reverse cholesterol transport).
MPO also oxidizes LDL and promotes foam cells. The video above discusses these foam cells. MPO also degrades the collagen layer which overlays the lipid core in unstable plaque. This makes this plaque more prone to rupture and cause a sudden heart attack.
Elevated MPO levels increase the risk of coronary heart disease 16 fold. That is a 1600% increased risk. Wow! The higher it is and the longer it is high the greater your risk. MPO is supposed to protect you. It is part of the immune system and helps kill infections. However, the continued stimulation starts causing problems.
MPO makes plaques unstable. It contributes to ischemic heart disease & plaques. It consumes and reduces Nitric Oxide (NO) and it contributes to endothelial dysfunction and vasoconstriction. As you can see, MPO is major bad stuff and contributes to inflammation, oxidative stress, and vascular immune dysfunction – the 3 finite responses that cause hypertension and cardiovascular disease.
How to make your HDL functional again:
Statins
Niacin – partially reverses the dysfunctional HDL by restoring its anti-inflammatory and anti-oxidative properties.
Spectracell is a cell function test not a nutrition test
The Spectracell Functional Intracellular Assay (FIA) test is one of the best and most comprehensive lab evaluations of your intra-cellular nutritional status. List to our Podcast on the Spectracell test.
Your health is dependent on the function of your individual cells.
I’m a soldier. I’ve been in the US Army for nearly 30 years. I’ve been amazed at the ability of the US military to accomplish some unbelievable tasks. Big stuff. But, these accomplishments are simply the sum total of each individual soldier doing their job. The better each soldier functions the better the Army functions.
It is the same thing with your body. Your body can’t be healthy if your individual cells aren’t healthy. You NEED your cells to function at the highest level possible!
Nutrition is quite simply the single most significant contributor to most of our patients’ health. We often recommend nutritional supplementation and daily vitamins and minerals.
But how do you know if you are getting enough?
Spectracell answers this question. It offers the comprehensive nutritional analysis. But it isn’t measuring nutrition levels. It is measuring cellular function. It tells us, based on cell performance, how your nutrition and supplements stack up.
I take supplements so why am I deficient?
That is a great question and we hear it all the time! There are several reasons your cells could be dysfunctional due to nutrient insufficiency.
Insufficient Intake – if you don’t get enough then it would make sense that your levels are too low. If you are taking a supplement and still low then you aren’t taking enough, they are poor quality supplements, or you have an absorption problem. Make sure you take the highest quality supplements available.
Absorption – either your intestines aren’t absorbing nutrients or the nutrients aren’t getting into the cells. Either of these can occur for a number of reasons.
Storage – if you eliminate the nutrients as fast as you get them in you can still be deficient. Also, some conditions will actually sequester nutrients. Anemia of chronic disease is an example.
Metabolism & Excretion – increased metabolism can deplete nutrients and may increase the need for higher levels. If you excrete nutrients at higher levels you could also be deficient.
Genetic influence – certain genetic SNPs may increase the need for higher levels of certain nutrients. Consider MTHFR.
Disease – higher levels of nutrients are required by some diseases
Drugs – numerous medications will deplete nutrients. For example, statins deplete CoQ10 & Omega-3s
Age – older patients may need additional supplementation
Pregnancy – an example is the increased need for folate during pregnancy. There are many others as well making Prenatal Vitamins a great idea!
Exercise – the increased metabolic processes during exercise may increase the need for higher levels of some nutrients.
Smoking – smoking also depletes a number of nutrients
Alcohol – same as smoking
There are many reasons why you may be functionally deficient in some nutrients and it is very important to understand these. It can be a game changer!
How Is The Spectracell Test Performed?
A mixture of lymphocytes (white blood cells) is isolated from the blood. We draw 2 blue and black top tubes to send to the lab.
These cells are grown in a defined culture medium containing optimal levels of all essential nutrients necessary to sustain their growth in cell culture.
The T-lymphocytes (T cells) are stimulated to grow with a mitogen called PHA (phytohemagglutinin) and growth is measured by the incorporation of tritiated (radioactive) thymidine into the DNA of the cells.
The growth response under optimal conditions (the optimal culture medium) is defined as 100% and all other growth rates are compared to this 100% level of growth. In other words, this baseline test is the standard for that patient. Each nutrient assessment test that is performed is compared to this baseline test.
For example – they remove Vitamin B6 from the medium and stimulate the cells to grow by mitogen stimulation. Growth is measured by DNA synthesis and the rate of growth is dependent only upon the functional level of Vitamin B6 available within the cells to support growth. For Vitamin B6 a growth rate of at least 55% of the growth rate observed in the optimal (100%) media is considered normal. Results less than 55% are considered to indicate a functional deficiency for Vitamin B6. Each nutrient has a different reference range that was established by assaying thousands of apparently healthy individuals.
What Does Spectracell Measure?
The Spectracell test measures cellular function based 34 different micronutrients. When they perform the test at the Spectracell lab they perform a baseline test where the white blood cells (T cells, specifically) are placed in a culture medium containing all of the nutrients they need to grow and function well.
The Spectracell report can be a little confusing and overwhelming. There is a lot of information there and understanding the results can be difficult.
Test Result (% Control) – This column represents the patient’s growth response in the test media measured by DNA synthesis as compared to the optimal growth observed in the 100% media.
Functional Abnormals – An interpretation is provided for those nutrients found to be deficient.
Reference Range – This column represents how this patient’s result compares to thousands of patients previously tested. The patient’s result is considered deficient when it is less than the reference range.
Graphs – The abnormal range of results is noted in the blue area. Abnormal results are indicated in red. The gray cross hatch area is a representation of the range of test results found in a random selection of subjects.
Spectrox Total Antioxidant Function
Spectrox is a measurement of overall antioxidant function. The patient’s cells are grown in the optimal media, stimulated to grow, and then increasing amounts of a free radical generating system (H2O2) are added. The cell’s ability to resist oxidative damage is determined. The increasing levels of peroxide will result in diminished growth rates in those patients with poor antioxidant function capacity.
The spectrox test is not measuring amounts of a given antioxidant. It is measuring your cells ability to detoxify the oxidative stress. Cells that are better able to defend against oxidation will have a higher score. You want your score to be high as it suggests optimal cellular function in regards to your ability to detoxify these oxidative free radicals.
Individual Antioxidant Levels
In the tests for individual antioxidants, it is determined which specific antioxidants may be deficient and thus affecting the Spectrox antioxidant function result. For these tests, the patient’s cells are preincubated (soaked in media containing high levels) with one of the nutrient antioxidants, i.e. selenium, and then the Spectrox test is repeated to determine if the addition of selenium improves the patient’s antioxidant function. This process is repeated for each individual antioxidant.
The Comprehensive Metabolic Panel (CMP) is a panel of labs evaluating your electrolytes, liver, and kidney function. While it does include several labs it is anything but comprehensive.
The anterior pituitary gland secretes TSH in response to the amount of T4 & T3 hormones in the blood. Just as the name implies, TSH stimulates the thyroid gland to secrete thyroid hormones. The higher the levels of T3 & T4 the less the body needs so TSH levels decline. When T3 & T4 levels are low TSH levels increase trying to stimulate more hormone production from the thyroid gland. This is called a negative feedback system.
I remember being taught in medical school that TSH is all you need in order to evaluate thyroid function. However, nothing could be further from the truth. The TSH gives us an idea of your thyroid function but it is far too simplistic to say that it is a thorough evaluation.
Hormones are essential to our overall function and have a dramatic effect on how we look, feel, and perform. Optimal hormone balance and function is critical to optimal function.

 What is Lp-PLA2?