How To Read Your CIMT Test Report
How To Read Your CIMT Test Report
 This is one post in a series of posts on CIMT Testing and will give you the information you need in order to read your CIMT Test Report.
The CIMT Test report provides quite a bit of information and it is broken down in to sections.
Carotid IMT Assessment
Your risk of experiencing a heart attack or stroke is graded by zone. The zone assigned is age and gender specific to you. Normal or thin Carotid IMT does not completely exclude coronary artery disease. The result of this test should be interpreted in conjunction with your medical history, symptoms, known risk factors, and other test results.
Then, there is the actual thickness of the intima-media layers. It is measured in millimeters.
- Normal/Low Risk = less than 0.6mm. This is our goal.
- Moderate Risk = 0.6-0.7mm
- High Risk = 0.7=0.95mm
Certainly, the actual thickness is important. However, it is also important that we know the CIMTAR or the CIMT Accretion Rate. That is, how much the CIMT changes over a year. Normal is less than 0.016mm per year. That is an incredibly small number. This is why it is important to get this test annually.
Carotid IMT is most closely correlated with hypertension and ischemic stroke.
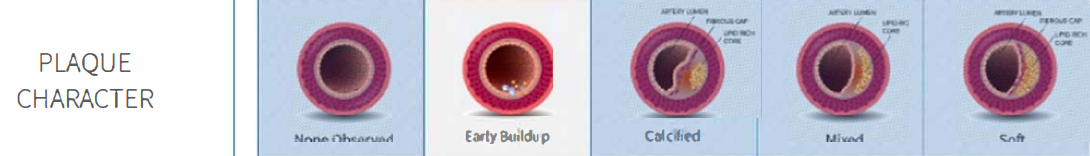
Plaque Character
Plaque or lesions develop when atherosclerosis in the arterial wall intrudes into the lumen. Plaque may be soft, mixed or calcified as outlined on Page 3 of the report. It is possible to have normal IMT and yet lesions may be present.
Percent Stenosis
Stenosis is the amount of blockage of the artery. It occurs when plaque intrudes into the lumen. If the plaque becomes large, it can reduce the flow of blood to critical areas.
Carotid plaque is most closely correlated with hyperlipidemia and smoking. Lipid rich plaques appear to increase the risk of heart attacks and strokes. The total plaque area is the most strongly predictive of cardiovascular risk of all of the ultrasound phenotypes.1
IMT and plaque are biologically and genetically distinct and thus respond differently to therapies for atherosclerosis. Plaques grow along the carotid arteries 2.4x faster than they thicken. Progression or regression of total plaque area is more sensitive to effects of therapy than IMT.2

The IMT Grade
CIMT uses a graphical illustration on the front page of the report to give a patient a “grade” of A through E based on comparing the actual IMT measurement to outcome data from a database of 40,000 patients with an average 6-year follow-up based on age and gender. The grade provides a ratio of increased risk for a coronary event based on the age and gender as outlined below.

IMT Score Relative Risk Of Clinical Event
- A = Very Unlikely – No increased risk
- B = Unlikely – Minimal increased risk
- C = Possible – Risk increased 1.5x
- D = Probably – Risk increased 1.5-2.0x
- E = Likely – Risk increased to 2.7x
If your CIMT Test score shows low risk that is great news. However, like so many other things in medicine, this test is not 100% sensitive nor 100% specific. That means that there is a chance you could still have disease even if your score is very good. Additionally, you could have a high risk score and never have a problem.
References
- Johnsen SH, Mathiesen EB. Carotid plaque compared with intima‐media thickness as a predictor of coronary and cerebrovascular disease. Curr Cardiol Rep. 2009; 11:21–27.
- Spence JD. Measurement of intima-media thickness vs. carotid plaque: uses in patient care, genetic research and evaluation of new therapies. Int J Stroke. 2006; 1:216–221.