This is one post in a series of posts on CIMT Testing and will give you the information you need in order to read your CIMT Test Report.
The CIMT Test report provides quite a bit of information and it is broken down in to sections.
Carotid IMT Assessment
Your risk of experiencing a heart attack or stroke is graded by zone. The zone assigned is age and gender specific to you. Normal or thin Carotid IMT does not completely exclude coronary artery disease. The result of this test should be interpreted in conjunction with your medical history, symptoms, known risk factors, and other test results.
Then, there is the actual thickness of the intima-media layers. It is measured in millimeters.
Normal/Low Risk = less than 0.6mm. This is our goal.
Moderate Risk = 0.6-0.7mm
High Risk = 0.7=0.95mm
Certainly, the actual thickness is important. However, it is also important that we know the CIMTAR or the CIMT Accretion Rate. That is, how much the CIMT changes over a year. Normal is less than 0.016mm per year. That is an incredibly small number. This is why it is important to get this test annually.
Carotid IMT is most closely correlated with hypertension and ischemic stroke.
Plaque Character
Plaque or lesions develop when atherosclerosis in the arterial wall intrudes into the lumen. Plaque may be soft, mixed or calcified as outlined on Page 3 of the report. It is possible to have normal IMT and yet lesions may be present.
Percent Stenosis
Stenosis is the amount of blockage of the artery. It occurs when plaque intrudes into the lumen. If the plaque becomes large, it can reduce the flow of blood to critical areas.
Carotid plaque is most closely correlated with hyperlipidemia and smoking. Lipid rich plaques appear to increase the risk of heart attacks and strokes. The total plaque area is the most strongly predictive of cardiovascular risk of all of the ultrasound phenotypes.1
IMT and plaque are biologically and genetically distinct and thus respond differently to therapies for atherosclerosis. Plaques grow along the carotid arteries 2.4x faster than they thicken. Progression or regression of total plaque area is more sensitive to effects of therapy than IMT.2
The IMT Grade
CIMT uses a graphical illustration on the front page of the report to give a patient a “grade” of A through E based on comparing the actual IMT measurement to outcome data from a database of 40,000 patients with an average 6-year follow-up based on age and gender. The grade provides a ratio of increased risk for a coronary event based on the age and gender as outlined below.
IMT Score Relative Risk Of Clinical Event
A = Very Unlikely – No increased risk
B = Unlikely – Minimal increased risk
C = Possible – Risk increased 1.5x
D = Probably – Risk increased 1.5-2.0x
E = Likely – Risk increased to 2.7x
If your CIMT Test score shows low risk that is great news. However, like so many other things in medicine, this test is not 100% sensitive nor 100% specific. That means that there is a chance you could still have disease even if your score is very good. Additionally, you could have a high risk score and never have a problem.
References
Johnsen SH, Mathiesen EB. Carotid plaque compared with intima‐media thickness as a predictor of coronary and cerebrovascular disease. Curr Cardiol Rep. 2009; 11:21–27.
Spence JD. Measurement of intima-media thickness vs. carotid plaque: uses in patient care, genetic research and evaluation of new therapies. Int J Stroke. 2006; 1:216–221.
You know the drill. Traffic is terrible on your way to see your doctor. You are running behind and doing the best you can to get there on time. The parking lot is full and you struggle to find a parking place. When you walk in they remind you that you are a bit late and the nurse whisks you to the back. She sits you down and immediately slaps a blood pressure cuff on your arm and informs you that “you’re blood pressure is awfully high today!”
There is a correct way to measure blood pressure and that isn’t it. Also, the blood pressure method used by virtually every doctor’s office is measuring a brachial (peripheral) blood pressure. It is the pressure in the brachial artery.
However, central blood pressure is a much better assessment of the strain on your heart as well as the risk of cardiovascular disease. Central blood pressure is the pressure in your aorta. It is the pressure your heart actually sees.
Central blood pressure is a better evaluation of your blood pressure than is a doctor’s office blood pressure. It is even better than the 24-hour ambulatory blood pressure monitor evaluation. However, if you have elevated blood pressure then you absolutely need a 24-hour ambulatory blood pressure monitor (ABPM). There are multiple reasons for this addressed on its post.
What is Central Blood Pressure (CBP)?
Central blood pressure is simply the pressure within the ascending aorta, the large artery coming off of the heart which distributes blood to the rest of the body.
Most people are aware of blood pressure as it related to the blood pressure that is checked when you go to your doctor’s office or the Emergency Room. However, the pressure which is generally being measured is the brachial blood pressure, the pressure in the brachial artery. This is referred to as a peripheral blood pressure.
The difference is that central blood pressure is a more accurate reflection of the stress on the heart itself as well as target organ damage (TOD). Target organ damage is the damage that is incurred due to the effect of the pressure on each organ.
Why should you check your Central Blood Pressure?
It is well know that hypertension contributes to cardiovascular disease.6 However, there is a discordance between the brachial blood pressure and central blood pressure.5 We routinely see patients with normal brachial blood pressures and elevated central blood pressures. We’ve also seen it the other way around.
Central blood pressure is a much better predictor of cardiovascular disease mortality, all cause mortality, diastolic heart dysfunction, and left ventricular hypertrophy than brachial blood pressure.
Target Organ Damage
Central blood pressure was checked in 1169 patients using applanation tonometry and SphygmoCor. 319 (27%) had “high-normal” blood pressure. (NOTE: this was prior to the new definitions and these patients had elevated BP or Stage 1 hypertension by the new guidelines). These participants’ blood pressures ranged from 120-139/80-89. Target Organ Damage (TOD) was assessed using Pulse Wave Velocity (PWV), Left Ventricular Mass Indexed to Height (LVMI), or Estimaged Glomerular Filtration Rate (eGFR).
Brachial blood pressures were not able to differentiate patients with target organ damage due to elevated blood pressure. However, central blood pressure values were able to identify target organ damage due to elevated blood pressure. “In contrast to normal versus high-normal BP categories which do not clearly distinguish normotensives with from those without organ damage, noninvasively determined aortic BP measurements may refine the ability to detect those with a normal/high-normal BP at risk of BP-related cardiovascular damage.”10
Central aortic blood pressure & brachial blood pressure enhances the ability to identify cardiovascular target organ damage (TOD). Both 24-hr central blood pressure & 24-hr brachial blood pressure are superior to conventional office BP measurements in predicting BP-related cardiac damage. Additionally, 24-hr central ambulatory blood pressure is more closely associated with left ventricular hypertrophy than 24-hr ambulatory brachial blood pressure.10-12
In other words, it seems that measurements of central blood pressure are always better than brachial blood pressure.
Better evaluation of medication effect
For years, medications have been the mainstay of medical therapy for hypertension. JNC 7 recommended diuretics or beta-blockers as first line therapy. However, neither of these medication classes are the best therapy for reducing target organ damage (TOD) and cardiovascular disease events.
These medications may decrease brachial blood pressure as measured in many of these studies. However, they often don’t have the same effect on central blood pressure. This means that they don’t reduce target organ damage. Additionally, the non-vasodilatory medications, while lowering brachial blood pressure, may actually INCREASE central blood pressure making things even worse!1,2
Heart Remodeling
Hypertension causes left ventricular remodeling. The heart muscle has to work harder due to the increased pressure which causes ventricular remodeling and hypertrophy. Central blood pressure evaluation correlates much better than brachial blood pressure for predicting left ventricular mass (a measure of hypertrophy) as determined by the Strong Heart Study published in the Journal of Hypertension.3
Risk of Death
Another study in the Journal of Hypertension looked at central vs peripheral blood pressures related to cardiovascular and all-cause death. I think it is very interesting that Central pulse pressure (the difference between systolic and diastolic blood pressures) was the only metric correlated to all cause mortality, death for any reason. This is, of course, obtained by measurement of the central blood pressure. However, ambulatory blood pressure (ABPM) is better for predicting cardiovascular mortality.4
Why doesn’t my doctor test this?
If central blood pressure measurements are so much better then why doesn’t my doctor do this?
That is a great question. It hasn’t been until the last year that I’ve seen anyone else check this in their clinic. To my knowledge, there are no other clinics measuring central blood pressure in the entire state of Oklahoma. It is one of the many things that sets our Functional Medicine Tulsa, OK clinic apart from the others.
In the past, central blood pressure could only be measured directly or invasively. This means that we need to insert catheters into the aorta in order to measure central blood pressure. Obviously, there are significant costs and risks associated with this and it wasn’t reasonable in many cases.
However, we now have the ability to measure central blood pressure non-invasively. This will help increase the utilization but these non-invasive devices are still very expensive, well over $10,000. Compare that to a simply blood pressure cuff (less than $100) and you can see why most physicians don’t check it.
How Is Central Blood Pressure Measured?
First, you should be adequately prepared for a proper blood pressure evaluation. Very few clinics actually do this correctly but you should do a few things before getting your blood pressure checked:
No caffeine within 6 hours
No exercise the morning of. If your appointment is in the afternoon then morning exercise is fine
No smoking for 4-6 hours
We use a non-invasive device (no needles or procedures) to check your central blood pressure. A blood pressure cuff will be placed around your arm and the SphygmaCor device will check your blood pressure in the same way as your normal blood pressure check.
It will check your blood pressure a couple of times then the cuff will partially inflate and stay that way for a few seconds then deflate. SphygmaCor then calculates your central blood pressure.
It sounds good but does it actually work?
It does! In fact, it has been validated in several studies when compared to invasively and directly measuring central blood pressure.
One study involved 52 patients who where undergoing invasive procedures also had their central blood pressure checked non-invasively using BPro and SphygmaCor. “cSBP differed by only 0.1±6mmHg (P=.913) between the two noninvasive devices. Therefore, both noninvasive devices showed an accurate agreement in cSBP compared with invasively measured cSBP.”7
This means, of course, that the non-invasive devices tested had the same results as actually measuring the central blood pressure directly. Therefore, central blood pressure as measured by SphygmoCor and BPro are accurate and can be trusted.
Another study evaluated the Pulsecor R6.5 device’s ability to measure central blood pressure in patients undergoing coronary angiography. Their conclusion stated that “Pulsecor R6.5 provides a simple and easy method to non-invasively estimate central SBP, which has highly acceptable accuracy.”8
Yet another study compared radial tonometry to the same types of devices above (i.e. SphygmoCor). Radial tonometry is considered an acceptable “alternative to invasive pressure measurements” in many cases.13 They concluded that the cuff-based non-invasive central blood pressure devices were a good alternative to tonometry. They went on to say that this type of testing “could lead to improved adoption of estimates of central BP in clinical practice.”9
Conclusions
The bottom line is that everyone should be measuring central blood pressure. It is a much better indicator of cardiovascular health and risk of target organ damage (TOD). The problem is that it is still expensive and you may have a very difficult time finding anyone who can measure it.
Hisashi Masugata & Shoichi Senda(2010)Clinical significance of central blood pressure measurement in antihypertensive treatment,Expert Review of Cardiovascular Therapy,8:6,763-765,DOI: 10.1586/erc.10.44
Williams B, Lacy P, Thom S, Cruickshank K, Stanton A, Collier D, Hughes A, Thurston H, O’Rourke M. Differential Impact of Blood Pressure–Lowering Drugs on Central Aortic Pressure and Clinical Outcomes. Principal Results of the Conduit Artery Function Evaluation (CAFE) Study. Circulation. 2006;113:1213–1225. https://doi.org/10.1161/CIRCULATIONAHA.105.595496
Schillaci, Giuseppe; Grassi, Guido. Central blood pressure: getting to the heart of the matter. J of Hypertension 2010;28:237-239. doi: 10.1097/HJH.0b013e3283359509
Huang, Chi-Ming; Wang, Kang-Ling; Cheng, Hao-Min; Chuang, Shao-Yuan; Sung, Shih-Hsien; Yu, Wen-Chung; Ting, Chih-Tai; Lakatta, Edward G; Yin, Frank CP; Chou, Pesus; Chen, Chen-Huan. Central versus ambulatory blood pressure in the prediction of all-cause and cardiovascular mortalities. J of Hypertension 2011;29:454-459. doi: 10.1097/HJH.0b013e3283424b4d
Thomopoulos C, Parati G, Zanchetti A. Effects of blood pressure lowering on outcome incidence in hypertension. 1. Overview, meta-analyses, and meta-regression analyses of randomized trials. J Hypertens. 2014 Dec;32(12):2285-95. doi: 10.1097/HJH.0000000000000378.
Ott, C. , Haetinger, S. , Schneider, M. P., Pauschinger, M. and Schmieder, R. E. (2012), Comparison of Two Noninvasive Devices for Measurement of Central Systolic Blood Pressure With Invasive Measurement During Cardiac Catheterization. The Journal of Clinical Hypertension, 14: 575-579. doi:10.1111/j.1751-7176.2012.00682.x.
Lin, Aaron C.W; Lowe, Andrew; Sidhu, Karishma; Harrison, Wil; Ruygrok, Peter; Stewart, Ralph. Evaluation of a novel sphygmomanometer, which estimates central aortic blood pressure from analysis of brachial artery suprasystolic pressure waves. J of Hypertension 2012;30:1743-1750. doi: 10.1097/HJH.0b013e3283567b94.
Park, Chloe M.a; Korolkova, Olgab; Davies, Justin E.a; Parker, Kim H.b; Siggers, Jennifer H.b; March, Katherinea; Tillin, Theresea; Chaturvedi, Nisha; Hughes, Alun D. Arterial pressure: agreement between a brachial cuff-based device and radial tonometry. J of Hypertension 2014;32:865-872. doi: 10.1097/HJH.0000000000000082
Booysen, Hendrik L.; Norton G, Maseko, Muzi J.a; Libhaber, Carlos D.b; Majane, Olebogeng H.I.a; Sareli, Pinhasa; Woodiwiss, Angela J. Aortic, but not brachial blood pressure category enhances the ability to identify target organ changes in normotensives. J of Hypertension 2013;31:1124-1130. doi: 10.1097/HJH.0b013e328360802a.
Salvi, Paolo; Schillaci, Giuseppe; Parati, Gianfranco. Twenty-four-hour ambulatory central blood pressure: new perspectives for blood pressure measurement? J of Hypertension 2014;32:1774-1777. doi: 10.1097/HJH.0000000000000318.
Protogerou, Athanase D; Argyris, Antonis A.a; Papaioannou, Theodoros G.b; Kollias, Georgios E.a; Konstantonis, Giorgos D.a; Nasothimiou, Efthimiaa; Achimastos, Apostolosc; Blacher, Jacquesd; Safar, Michel E.d; Sfikakis, Petros P. Left-ventricular hypertrophy is associated better with 24-h aortic pressure than 24-h brachial pressure in hypertensive patients: the SAFAR study. J of Hypertension 2014;32:1805-1814. doi: 10.1097/HJH.0000000000000263.
Weiss BM, Spahn DR, Rahmig H, Rohling R, Pasch T. Radial artery tonometry: moderately accurate but unpredictable technique of continuous non-invasive arterial pressure measurement. Br J Anaesth. 1996 Mar;76(3):405-11.
Are you worried you’ll have a Heart Attack or Stroke?
CIMT Testing may help
I’ve said it many times, in case you didn’t already know, cardiovascular disease is the #1 killer of men and women in both the United States and the world.
I work in the Emergency Department (as well as my functional medicine clinic in Tulsa, OK) and I can’t tell you how many men and women come in to the ER having a heart attack and had no idea they had cardiovascular disease.
Undetected cardiovascular disease is the GREATEST RISK facing Americans today.
It gets worse. According to the AHA 2002 and 2009 Heart & Stroke Statistical Updates, cardiovascular disease increased 33% in 7 years. That’s scary!3
For every woman who dies of breast cancer, 8 women will die from cardiovascular disease (heart attacks). We are doing better with identifying and treating breast cancer as the number of deaths are decreasing. However, cardiovascular disease is increasing. More women than men over the age of 64 have hypertension. After the age of 45, hypertension risk is the same in women as it is in men. Women have more strokes than men (55,000 more per year to be exact).3
Testing for cardiovascular disease involves an evaluation of
risk factors (lipids, family history, inflammation, genetics, etc)
Many tests for cardiovascular disease and disease risk involve population or statistical evaluations meaning that we compare, through statistical analysis, what we see in the population and what is the likelihood that population has a certain outcome. It is good for epidemiology and statistics but does NOT tell us about YOUR specific risk.
Who Should Get CIMT Testing?
The SHAPE Guideline recommends screening for all asymptomatic men age 45-75 and women age 55-75.9 The purpose is to identify and treat patients with sub-clinical cardiovascular disease just like the patients mentioned at the beginning of this article. SHAPE estimated that 50 million people in the United States should be getting this screening.
Patients with other risk factors such as hypertension, hyperlipidemia, obesity, diabetes, or metabolic syndrome should be screened at younger ages than listed above due to the fact that they are at higher risk of cardiovascular disease.
You need CIMT testing if you meet any of the following criteria:
Men over 45 years of age
Women over 55 years of age
Hypertension
Hyperlipidemia
Obesity
Diabetes
Metabolic Syndrome
What is CIMT Testing?
Carotid Intima Media Thickness (CIMT) Testing measures the thickness of the wall of the inner two layers of the carotid artery. It is one of the best ways to look at the structure of the carotid artery and determine future risk of Heart Attacks and Strokes.
One of the great things about carotid IMT is that it is an actual measurement of vascular disease in you. It isn’t a statistical or population based evaluation. It is actual disease. It measures the amount of plaque in the carotid artery as well as the thickness of the artery itself and it tells us about your specific risk.
CIMT testing is FDA approved and involved the use of an ultrasound to take pictures of the carotid artery in your neck. The test is painless and quick. A small amount of ultrasound gel is placed on your neck so that the ultrasound probe can accurately take the required images. The ultrasound probe is then scanned over your neck taking the images which are sent to the radiologist for analysis.
The report comes back to our office in 2-3 days and we will go over the results with you during an office visit.
This image shows a progression of vascular disease and plaque. You’ll note that intimal thickening occurs very early in the process. That is why measuring intima media thickness in the carotid is a good idea. It allows us to qualify and quantify vascular disease specifically.
We aren’t looking at risk factors or “what is the likelihood.” We are looking at actual disease. And the thicker your CIMT the worse the disease.
Measuring CIMT allows us to detect the presence of cardiovascular disease at a very early stage in a way that most other tests do not. It allows patients to take a specific look at their cardiovascular health.
Once we identify cardiovascular disease we can begin to intervene. Once you see that you have some vascular disease you can begin to make changes.
CIMT also allows us to track our progress. We’ll put you on a plan to improve your cardiovascular health and CIMT testing will tell us if our plan is working! There aren’t many other tests that can do this. And, we can improve CIMT with proper therapy by the way.4
I don’t know if it is sad or funny but we use all kinds of screenings to identify early stage cancer in patients without any symptoms (think pap smears, colonoscopies, and mammograms to name a few) but try to get a screening test for cardiovascular disease through your regular doctor. It is very difficult because insurance doesn’t want to pay for it. Yet all forms of cancer combined account for far fewer deaths per year compared to cardiovascular disease.
What Does The Research Say?
CIMT is a well validated test. The benefits of this test are all over the medical literature. The validity of CIMT testing is well documented throughout peer reviewed medical journals.
The American Heart Association published guidelines in 2000 validating CIMT as a test for the early detection of cardiovascular disease.
CIMT Testing has been conclusively demonstrated as a surrogate endpoint for atherosclerosis, cardiovascular disease, future risk of heart attacks, future risk of stroke, future risk of TIA, and correlates well with risk factors.1
Carotid IMT is an independent predictor of vascular events in high risk patients in whom risk factors are managed clinically. One standard deviation in IMT increase was associated with increased vascular events (RR 1.57) with a high range of 2.5-6.3 from mid to high tertile.2
Carotid US is a safe and available non-invasive diagnostic tool that provides information about the carotid arteries’ characteristics and may be used for early detection of coronary artery disease as well as cardiovascular and stroke event risk stratifications.[3]
According to the Journal of the American Heart Association, CIMT is a surrogate marker of atherosclerosis.3 In other words, if your CIMT is increased then you have atherosclerosis. CIMT is a well validated predictive test for clinical coronary events. This was published in the Annals of Internal Medicine.3 Similar articles have been published in ‘Stroke’ from the Journal of the American heart Association and the Journal of the College of Cardiology.
The “2010 ACCF/AHA Guideline for Assessment of Cardiovascular Risk in Asymptomatic Adults: A Report of t he American College of CardiologyFoundation/American Heart Association Task Force on Practice Guidelines” recommended CIMT for detection of atherosclerosis in asymptomatic patients.”7
The Mayo Clinic summarized the value of carotid IMT in its March, 2009 edition of the Mayo Clinic “Proceedings” magazine in which it stated the following: “Conclusion – A CIMT evaluation can detect subclinical vascular disease in young to middle-aged patients with low FRS and CACS of zero. These findings have important implications for vascular disease screening and the implementation of primary–prevention strategies.”8
The Screening for Heart Attack Prevention and Education (SHAPE) Task Force has recommended a new practice guideline for cardiovascular screening in the asymptomatic at-risk population. This group was comprised of leading cardiologists throughout the country. In summary, the SHAPE Guide line calls for noninvasive screening of all asymptomatic men 45-75 years of age and asymptomatic women 55–75 years of age (except those defined as very-low-risk) to detect and treat those with sub-clinical atherosclerosis. The SHAPE Report points out that “In the existing guidelines the low–risk and intermediate-risk population account for the majority of heart attacks, and only less than 20% of the total number of the events results from the high-risk population.”9
CIMT and Coronary Artery Calcium Score
The Coronary Artery Calcium Score (CACS) is a CT scan of the heart that allows quantification of calcium in the coronary arteries. The Calcium Score is a very useful test and if you have an elevated score then you can bet that you have cardiovascular disease. The CACS is a proven test useful for predicting risk of future heart attacks.
However, I have seen patients with a coronary calcium score of 0 (zero) have a heart attack a year later. It is a good test but not perfect. This test is a part of our comprehensive cardiovascular screening exam.
Coronary Artery Calcium Scoring has been available longer than CIMT testing. Therefore, it is more widely available. However, these 2 tests provide very different information.
First, the Coronary Artery Calcium Score is looking at the arteries around your heart and the CIMT is looking at the carotid arteries.
CIMT is measuring the atherosclerotic plaque in the wall of the carotid artery. The coronary artery calcium score does not look at this. It cannot detect vascular disease this early.
Coronary artery calcium scoring cannot determine plaques that are soft or mixed. CIMT does pick these up. This issue explains why I’ve seen patients have heart attacks with a normal coronary artery calcium score.
CIMT also appears to detect subclinical atherosclerosis in low-risk patients. The Journal of the American Society of Echocardiography stated “In asymptomatic patients without cardiovascular disease, CIMT and plaque assessment are more likely to revise FRS than CACS. Body mass index predicts increased CIMT in low-FRS subjects. These findings may have broad implications for screening in low–FRS subjects.”10 In other words, the CIMT may help determine risk of cardiovascular disease better than coronary artery calcium score in patients with low Framhingham Risk Scores (FRS).
Touboul PJ, Hennerici MG, Meairs S, Adams H, Amarenco P, Bornstein N, Csiba L, Desvarieux M, Ebrahim S, Fatar M, Hernandez Hernandez R, Jaff M, Kownator S, Prati P, Rundek T, Sitzer M, Schminke U, Tardif JC, Taylor A, Vicaut E, Woo KS, Zannad F, Zureik M. Mannheim carotid intima-media thickness consensus (2004-2006). An update on behalf of the Advisory Board of the 3rd and 4th Watching the Risk Symposium, 13th and 15th European Stroke Conferences, Mannheim, Germany, 2004, and Brussels, Belgium, 2006. Cerebrovasc Dis. 2007;23(1):75-80. Epub 2006 Nov 14
Results of the Osaka Follow-Up Study for Carotid Atherosclerosis 2 (OSACA2 Study) Kitagawa K. Hougaku H. Yamagami H. Hashimoto H. Itoh T. Shimizu Y. Takahashi D. Murata S. Seike Y. Kondo K. Hoshi T. Furukado S. Abe Y. Yagita Y. Sakaguchi M. Tagaya M. Etani H. Fukunaga R. Nagai Y. Matsumoto M. Hori M. Carotid Intima-Media Thickness and Risk of Cardiovascular Events in High-Risk Patients. Cerebrovasc Dis 2007;24:35–42 (DOI:10.1159/000103114)
Lloyd-Jones D, et al. Heart Disease and Stroke Statistics—2009 Update. A Report From the American Heart Association Statistics Committee and Stroke Statistics Subcommittee. Circulation. 2008;119:e21–e181.
Wendy J. Mack, PhD; Robert H. Selzer, MS; Howard N. Hodis, MD; Joel K. Erickson, BS; Chao-ran Liu, MD; Ci-hua Liu, MD; Donald W. Crawford, MDt; David H. Blanken horn, MD, “One–Year Reduction and Longitudinal Analysis of Carotid Intima-Media Thickness Associated With Colestipol/Niacin Therapy,” Stroke, Journal of the American Heart Association, 1993;24;1779-1783.
Eric de Groot, MD, PhD; G. Kees Hovingh, MD; Albert Wiegman, MD; Pat rick Duriez, PhD; Andries J. Smit, MD, PhD; Jean-Charles Fruchart, PhD; John J.P. Kastelein, MD, PhD; “Measurement of Arterial Wall Thickness as a Surrogate Marker for Atherosclerosis.”Circulation, Journal of the American Heart Association;2004;109;33-38.
Howard N. Hodis, MD; Wendy J. Mack, PhD; Laurie La Bree, MS; Robert H. Selzer, MS; Chao-ran Liu, MD; Ci-hua Liu, MD; and Stanley P. Azen, PhD: “The Role of Carotid Arterial lntima-Media Thickness in Predicting Clinical Coronary Events” Annals of Internal Medicine, 15 February, 1998: 262-269.
STEVEN J. LESTER MD, FRCPC, MACKRAM F. ELEID, MD; BIJOYK K. HANDHERIA, MD; AND R. TODD HURST, MD, “Carotid lntima-Media Thickness and Coronary Artery Calcium Score as Indications of Subclinical Atherosclerosis,” Mayo Clinic Proceedings, March 2009;84(3):2 29-233
Philip Greenland, Joseph S. Alpert, George A. Beller, Emelia J. Benjamin, Matthew J. Budoff, Zahi A. Fayad, Elyse Foster, Mark A. Hlatky, John McB. Hodgson, Frederick G. Kushner, Michael S. Lauer, Leslee J. Shaw, Sidney C. Smith, Jr, Allen J. Taylor, William S. Weintraub, and Nanette K. Wenger, “2010 ACCF/AHA Guideline for Assessment of Cardiovascular Risk in Asymptomatic Adults: A Report of the American College of Cardiology Foundation/American Heart Association Task Force on Practice Guidelines” Developed in Collaboration With the AmericanSociety of Echocardiography American Society of Nuclear Cardiology, Society of AtherosclerosisIm aging and Prevention, Society for CardiovascularAngiography and Interventions, Society of Cardiovascular Computed Tomography, and Society for Cardiovascular Magnetic Resonance J. Am. Coll. Cardiol. 2010;56;e50-el03 originally published on line Nov 15, 2010
Morteza Naghavi, MD, Erling Falk, MD, PhD, Harvey S. Hecht, MD, Michael J Jamieson, MD, Sanjay Kaul, MD, MPH, Daniel Berman, MD, Zahi Fayad, PhD, Matthew J. Budoff, MD, John Ru mberger,MD, PhD, Tasneem Z. Naqvi, MD, Leslee J. Shaw, PhD, Ole Faergeman, MD, Jay Cohn, MD, Raymond Bahr, MD, Wolfgang Koenig, MD, PhD, Jasenka Demirovic, MD, PhD, Dan Arking, PhD, Victoria L.M.Herrera, MD, Juan Badimon, PhD, James A. Goldstein, MD, Yoram Rudy, PhD, Juhani Airaksinen, MO, Robert S. Schwartz, MD, Ward A. Riley, PhD, Robert. A. Mendes, MD, Pamela Douglas, MD, Prediman K. Shah, MD; “From Vulnerable Plaque to Vulnerable Patient – Part 111: Executive Summary of the Screening for Heart Attack Prevention and Education (SHAPE) Task Force Report, 8 June 2006; The American Journal of Cardiology, 17 July 2006 (Vol. 98, Issue2 (Supplement 1), Pages 2-15).
Tasasneem Z. Naqvi, MD, FRCP, FACC, Fernando Mendoza, MD, Farhad Rafii, MD, Heidi Gransar, Maria Guerra, Norman Lepor, MD, FACC, FAHA, Daniel S. Berman, MD, FACC, FAHA, and Prediman K. Shah, MD, FACC, FAHA, Los Angeles, California, “High Prevalence of Ultrasound Detected Carotid Atherosclerosis in Subjects with Low Framingham Risk Score: Potential Implications for Screening for Subclinical Atherosclerosis.”Journal of the American Society of Echocardiography, 2010;23:809–15.
Kupetsky-Rincon EA, Uitto J. Magnesium: novel applications in cardiovascular disease–a review of the literature. Ann Nutr Metab. 2012;61(2):102-10.
The Ambulatory blood pressure monitor (ABPM) is the GOLD STANDARD for adequately and appropriately measuring blood pressure.
The Joint National Committee on Hypertension recommended the use of Ambulatory Blood Pressure Monitoring in 2003.17
In fact, you can’t properly evaluate and treat hypertension without it!
What is Ambulatory Blood Pressure Monitoring (ABPM)?
24-hour ambulatory blood pressure monitors (ABPM) measure your blood pressure in your environment. It is a portable blood pressure device that we have available in our Tulsa Functional Medicine clinic and check-out to our patients.
It consists of a blood pressure cuff (very similar to the one’s you’ve probably seen) but this one is designed to be worn all day along with an electronic monitor (think of a slightly large cell phone) that you can clip to your belt or wear over your shoulder.
The monitor inflates the cuff and checks your blood pressure about every 30 minutes while you are awake and about every 45-60 minutes while you sleep. You need all of this information in order to really understand your blood pressure.
After 20-24 hours you can take the monitor off and return it to the clinic where we will download the information into a report where it will be read by one of our providers.
This monitor will help us decide what type of hypertensive medications or supplements (if any) you may need, how much to use, and when to take them.
Why do we need 24-hour Ambulatory Blood Pressure Monitoring (ABPM)?
Mark Houston, MD, founder of the Hypertension Institute in Nashville, says “if you don’t do a 24-hour ambulatory blood pressure monitor you are approaching medical malpractice.” He goes on to say that you can’t know what drug to use, how much to give, or when to give it without a 24-hour ABPM.”
Virtually everyone should have a 24-hour ambulatory blood pressure monitor at least once!
ABPM is the recommended screening of Hypertension in the UK. It is superior to office and home blood pressure monitoring to predict future cardiovascular events, morbidity, mortality, and target organ damage.
Ambulatory Blood Pressure Monitoring (ABPM) is more accurate than blood pressures obtained in the doctor’s office. ABPM is more predictive of risk for cardiovascular disease events (heart attacks and strokes).
24-hour ambulatory blood pressure monitoring (ABPM) determines ‘dipping status’, white coat hypertension, masked hypertension, circadian rhythm with early morning blood pressure surges, and adequacy of blood control. Ambulatory Blood Pressure Monitoring (ABPM) is cost effective and reduces the number of patients needing drug therapy for hypertension by 25%.1-3, 13
I’ve seen multiple patients who appeared to have hypertension in the office who turned out to have white-coat hypertension and didn’t need blood pressure medications. However, there is also a condition called “masked hypertension” where blood pressure is normal in the doctor’s office but elevated everywhere else.
We simply can’t rely on office BP measurements.4 For years, the standard method for measuring blood pressure has been manual blood pressure monitoring in the doctor’s office. However, manual blood pressure measurements are relatively inaccurate, over-diagnose hypertension by provoking office-induced increases in BP, and correlates poorly with both the awake ambulatory BP and target organ damage. Automated office Blood Pressure (AOBP) is another option for evaluating blood pressure.7
The CAMBO trial showed that automated office blood pressure is better than manual office blood pressure for evaluating and identifying masked hypertension.8
In 2011, the UK National Clinical Guideline Centre (NCGC) guidelines for the management and treatment of hypertension recommended routine use of ambulatory blood pressure monitoring. These guidelines recommended that clinicians “offer ABPM to confirm the diagnosis of hypertension.” In some cases, they recommended waiting for the ABPM results before initiating anti-hypertensive therapy.11
“Compared with making the diagnosis with clinic or home BP monitoring, not only was ABPM determined to be the most cost‐effective approach in all age and sex subgroups, it also led to an improvement in quality health outcomes and was cost‐saving when long‐term costs were taken into account.”11 They went on to say “PCPs should be encouraged to either purchase an ABPM device or seek out specialists who have a device available for use.”11
Good luck trying to find it though.
When I left the military and moved back to Oklahoma I called the cardiology clinic in my group and asked them about ambulatory blood pressure monitoring. They didn’t do it and didn’t know who did. I haven’t been able to find anyone in Oklahoma that does it except us.
What does 24-hour Ambulatory Blood Pressure Monitoring (ABPM) identify?
Assessing hypertension in the elderly, children/adolescents, pregnancy, high-risk patients
Identify ambulatory hypotension
Identify blood pressure patterns in Parkinson’s Disease
Endocrine hypertension
European Society of Hypertension Position Paper on ABPM
The European Society of Hypertension position paper on ambulatory blood pressure monitoring gives a very nice overview of the scientific evidence for ABPM. The position paper reviews the history, pros and cons of ABPM, cost-effectiveness, appropriate use, how to select an ABPM device, how to implement the device into practice, indications for testing, and interpretation.9
Dipping Blood Pressure
The difference between daytime blood pressure and night time blood pressure is known as blood pressure “dipping.” A normal decrease in blood pressure (dip) is 10-20%. The phenomenon of dipping was first described in 1988 in the Lancet.14
Non-dipping
If your blood pressure doesn’t dip at least 10% then you are considered a “non-dipper” and this is predictive of a future adverse cardiovascular event (such as a heart attack).15
Why non-dipping occurs
At night, you should have decreased sympathetic nervous system (SNS) tone which should decrease blood pressure. If you have increased SNS tone and elevated Angiotensin II then you won’t have sufficient dipping (less than 10%). The non-dipping allows for sodium excretion in the kidney.
Risk for ischemic stroke increases if there is excessive dipping (more than 20%).12
Blood pressure load
Another advantage of 24-hour ambulatory blood pressure monitoring (ABPM) is its ability to measure the Blood Pressure Load.
The blood pressure load is the percentage of blood pressure measurements over 140/90. It should be less than 15% for normal. Anything about 15% would be considered abnormal or elevated.
BP load is associated with cardiovascular target organ damage but not independently of the 24 hour blood pressure level. However, more prospective studies with more severe hypertension and those with target organ damage but be done to verify.5,6
Definitions:
Percentage of blood pressure readings over 140/90. Over 15% is abnormal.
Percentage of daytime blood pressure readings over 135/85
A daytime systolic blood pressure over 135 for over 24.5% of readings
Percentage of night time blood pressure readings over 120/70
References:
Bloch, M. J. and Basile, J. N. (2011), UK Guidelines Call for Routine 24‐Hour Ambulatory Blood Pressure Monitoring in All Patients to Make the Diagnosis of Hypertension—Not Ready for Prime Time in the United States. The Journal of Clinical Hypertension, 13: 871-872. doi:10.1111/j.1751-7176.2011.00551.x
Liu, Ming; Li, Yan; Wei, Fang-Fei; Zhang, Lu; Han, Jing-Ling; Wang, Ji-Guang. Is blood pressure load associated, independently of blood pressure level, with target organ damage? Journal of Hypertension 2013;31:1812-1818. doi: 10.1097/HJH.0b013e3283624f9b.
Alpert BS, Quinn D, Gallick D. Oscillometric blood pressure: a review for clinicians. J Am Soc Hypertens. 2014 Dec;8(12):930-8. doi: 10.1016/j.jash.2014.08.014.
Sebo P, Pechère-Bertschi A, Herrmann F, Haller D, Bovier P. Blood pressure measurements are unreliable to diagnose hypertension in primary care. J of Hypertension: March 2014 – Volume 32 – Issue 3 – p 509–517
Liu M, Li Y, Wei FF, Zhang L, Han JL, Wang JG. Is blood pressure load associated, independently of blood pressure level, with target organ damage? J Hypertens. 2013 Sep;31(9):1812-8. doi: 10.1097/HJH.0b013e3283624f9b.
Rockwood K, Rockwood MR, Mitnitski A. Physiological redundancy in older adults in relation to the change with age in the slope of a frailty index. J Am Geriatr Soc. 2010 Feb;58(2):318-23. doi: 10.1111/j.1532-5415.2009.02667.x.
Myers M. The great myth of office blood pressure measurement. J Hypertens. 2012 Oct;30(10):1894-8.
Myers MG, Godwin M, Dawes M, Kiss A, Tobe SW, Kaczorowski J. The conventional versus automated measurement of blood pressure in the office (CAMBO) trial: masked hypertension sub-study. J Hypertens. 2012 Oct;30(10):1937-41.
O’Brien E, Parati G, Stergiou G, Asmar R, Beilin L, Bilo G, Clement D, de la Sierra A, de Leeuw P, Dolan E, Fagard R, Graves J, Head GA, Imai Y, Kario K, Lurbe E, Mallion JM, Mancia G, Mengden T, Myers M, Ogedegbe G, Ohkubo T, Omboni S, Palatini P, Redon J, Ruilope LM, Shennan A, Staessen JA, vanMontfrans G, Verdecchia P, Waeber B, Wang J, Zanchetti A, Zhang Y. European Society of Hypertension position paper on ambulatory blood pressure monitoring. J Hypertens. 2013 Sep;31(9):1731-68. doi: 10.1097/HJH.0b013e328363e964.
Michael A. Weber M, Schiffrin E, White W, Mann S, Lindholm L, Kenerson J, Flack J, Carter B. Clinical Practice Guidelines for the Management of Hypertension in the Community. J of Clinical Hypertension 2013;15:681
Bloch M, Basile J. UK Guidelines Call for Routine 24‐Hour Ambulatory Blood Pressure Monitoring in All Patients to Make the Diagnosis of Hypertension—Not Ready for Prime Time in the United States. J of Clinical Hypertension 2011;13(12):871
Bloomfield D, Park A. Night time blood pressure dip. World J Cardiol. 2015 Jul 26; 7(7): 373–376.
Koroboki E, Manios E, Psaltopoulou T, Vemmos K, Michas F, Alexaki E, Zakopoulos N. Circadian variation of blood pressure and heart rate in normotensives, white-coat, masked, treated and untreated hypertensives. Hellenic J Cardiol. 2012;53:432–438.
O’Brien E, Sheridan J, O’Malley K. Dippers and non-dippers. Lancet. 1988;2:397.
Mousa T, el-Sayed MA, Motawea AK, Salama MA, Elhendy A. Association of blunted nighttime blood pressure dipping with coronary artery stenosis in men. Am J Hypertens. 2004;17:977–980.
Bellelli G, Frisoni GB, Lucchi E, Guerini F, Geroldi C, Magnifico F, Bianchetti A, Trabucchi M. Blunted reduction in night-time blood pressure is associated with cognitive deterioration in subjects with long-standing hypertension. Blood Press Monit. 2004;9:71–76.
Chobanian AV, Bakris GL, Black HR, Cushman WC, Green LA, Izzo JL, Jones DW, Materson BJ, Oparil S, Wright JT, et al. Seventh report of the Joint National Committee on Prevention, Detection, Evaluation, and Treatment of High Blood Pressure. Hypertension. 2003;42:1206–1252.
Hermida RC, Moya A, Crespo JJ, Otero A, Dominguez M, Rios MT, Castineira C, Mojon A, Fernandez JR, Ayala DE. Asleep blood pressure is an independent predictor of cardiovascular events: the Hygia project. J Heart Disease. 2014;11:36.
The autonomic nervous system (ANS) mediates the body’s initial response to physical, physiological, or psychological stress. The ANS is a component of the peripheral nervous system. It is responsible for involuntary and reflexive bodily function. The ANS controls many body organs such as the heart, adrenal gland, and gastrointestinal (GI) tract. It plays an important role in an individual’s overall health and ability to handle stress. The ANS is composed of the sympathetic and parasympathetic nervous system. The sympathetic nervous system (SNS) produces the “fight or flight” response in stressful situations. It quickly mobilizes energy while increasing blood pressure, heart rate, and blood flow to muscles which are all necessary for responding to short-term stressors. SNS tone is a biological marker of age. As we age, our production of adrenalin decreases and cortisol increases but eventually both decrease.
Conversely, the parasympathetic nervous system (PSNS) allows us to “rest and digest” in non-stressful situations. It counters the effects of the SNS and conserves the energy stores of the body. PSNS promotes relaxation following a stressful event. It is most active during sleep, meditation, or other restful states. PSNS is a biological marker for health reserves and adaptive capacity. It promotes relaxation and is important for sleep.
There is a constant interplay between the SNS and PSNS and each balances the other. For example, during a short-term stressful event, the SNS increases blood pressure, heart rate, and breathing while decreasing GI function. Subsequently, after the stressor subsides, the PSNS decreases heart rate, breathing, blood pressure, and restores digestion allowing the body to return to a restful state.
Heart Rate Variability (HRV) reflects the simultaneous affect of the SNS and PSNS on the heart, which results in a beat-to-beat variability on an electrocardiographic (ECG) rhythm strip. A change in the normal autonomic regulation of heart rate may reflect the impact of a stressor on the body and can detect the early signs of pathologic developments or functional disorders, which may not be detected with routine physical or laboratory examinations.
HRV analysis provides a visual representation of heart rate referred to as the “method of rhythmography” or electrocardiograph (ECG). The lines on the ECG are longer (taller) under the influence of the PSNS and shorter (smaller) when under the influence of the SNS. HRV is performed in a supine position to promote PSNS tone, which occurs during relaxation and an upright position to stimulate SNS tone, which simulates a short-term stressor. HRV is a measurement of SNS and PSNS tone and respectively one’s ability to adapt to stress and relax.
Assessment of the Physical Fitness Level
Fig 1 Normal Transition Period and Fitness Level Graph
Assessment of the transition period:
The period of transition occurs when an individual goes from a lying to a standing position. Normally when one stands, the heart rate increases to compensate from a drop of blood pressure that occurs upon standing. The assessment of the transition period graph should show a dip (represents faster heart beats) reflecting an increase in heart rate upon transitioning from a supine to an upright position. The ability to increase heart rate upon standing reflects the overall adaptability of an individual.
Chronotropic Reaction measures one’s adaptability (SNS tone) and should range from 0.59-0.63.
Compensation Response measures one’s fitness (PSNS tone) and measures how well one recovers from a stressor (standing up). It should range from 0.59-0.63 or slightly higher.
Ortho-Test Ratio measures the ratio of heart rate upright to heart rate supine. The ratio should be close to 1.00. When one is not fit, chronotropic reaction level (level of adaptability or SNS tone) and compensation response (level of fitness or PSNS tone) ratio is greater than 1.00 and there is no dip during the transition period.
Recommendations:
If chronotropic reaction is above normal, consider Revolution.calm & L-Theanine
If chronotropic reaction is below normal, consider NeuroMax
If compensation response is below normal, consider Revolution.calm, Serenity Now & ProbioHealth.
Your chronotropic reaction is: _____normal ______above normal ______below normal
Your compensation response is: ____normal _____above normal ______below normal
Graphic Presentation of the Physical Fitness (see Figure 1 above)
Physical fitness level measures one’s level of wellness (compensation response or PSNS tone) versus their adaptability (chronotropic reaction or SNS tone). The lower the number on the level of wellness and adaptability axis, the better the individual’s physical fitness. Conversely, the higher the numerical number on the level of wellness and adaptability axis, the worst the individuals physical fitness. Well-trained athletes usually fall in the upper left quadrant or 1/1 ranges of the graphical presentation of physical fitness. Those of average fitness fall in the middle or 7/4 ranges of the graph. Those who fall in the lower right quadrant in the 13/7 ranges (below the red line in figure 1 of graphic presentation of the physical fitness) are considered to exhibit the worst physical fitness.
Your fitness level is ________Normal (left side of red line) _______Low Normal (right side of red line) _______Athletic Zone ________Below Normal
Recommendations for Average to Below Normal Fitness:
Revolution Essentials
Increase exercise, relaxation and deep breathing techniques.
Assessment of ANS Functional State Based on Heart Rate Variability Analysis
Electrocardiogram Rhythm Strip
Electrocardiographic rhythm strip or rhythmogram provides an assessment of the PSNS and SNS function in a supine and upright position. See figure 2 below.
HF (high frequency or taller lines on the ECG) reflects PSNS function and acetylcholine production.
LF (low frequency or shorter line) represents the combined affect of SNS activity and adrenal cortisol output.
LF1 reflects epinephrine and norepinephrine production by the SNS
LF2 represents cortisol hormone production by the adrenal gland
Orthostatic pattern correction (OPC) on the ECG rhythm strip refers to a pattern, which occurs during the transition from supine to standing position. OPC reflects how well one responds to stress. It measures whether the body responds appropriately to a short-term stressor, i.e. standing up with a short-term increase of SNS tone and epinephrine and norepinephrine production. This event typically results in a dip in the ECG rhythm strip. If the body responds to the stress of standing with cortisol hormone production, there is no dip in the ECG strip. This condition is indicative of adrenal and SNS dysfunction. It represents that there is no short-term adaptability or SNS reserve.
Normal Rhythm Strip should show multiple variations and looks like “uncut grass on waves”
Normal Supine – multiple, high frequency “uncut grass-like” patterns
Normal Upright – lower frequency “wave-like” patterns (SNS) with high frequency pattern (PSNS) on top
Your rhythm strip shows: ______very good variability __________average variability ______little or flat variability ________Spikes & Dips (____few _____multiple)
The sharper and more regular the fluctuation pattern, the healthier the ECG rhythm strip. The PSNS and the SNS activity have different influences on a normal rhythmogram. A healthy PSNS rhythm strip contains numerous, high frequency variations, while a SNS influenced strip typically has a more “wavy” patter, like waves on water, than uncut grass-like pattern. During the OPC, SNS initially predominates to increase heart rate and blood pressure, which results in a brief dip. The strip recovers as the PSNS balances the effects of the SNS.
If cortisol production is predominant instead of epinephrine and norepinephrine (SNS) and acetylcholine (PSNS), there is no variability of the ECG strip or dip during the OPC period and the strip becomes flattened. This indicates chronic stress.
An ECG rhythm strip can detect conductive problems with the heart muscle pacemaker cells. An ectopic beat pattern occurs when dips in the strip are followed by “spikes” which represent ectopic beats. When this pattern appears frequently throughout the strip, a referral to a cardiologist may be recommended.
If there are only a few spikes and dips present, it may just be an artifact or may represent a stressful state in which case further evaluation by a cardiologist may not be needed. HRV should be repeated to assess if the treatment of the stressful state resolves the spikes and dips. If the spikes and dips worsen, do not resolve with treatment, or if the patient is symptomatic, a referral to a cardiologist should be considered.
Graphical Presentation of the ANS Condition:
This graph depicts the activity of the PSNS and SNS when going from a supine to an upright position.
Supine: When lying down, the point should be positive number on PSNS axis reflecting normal PSNS activity, which occurs during relaxation. If the point has a negative value, PSNS activity is diminished which means that the ability to rest, relax, and digest is sub-optimal.
Upright: The point should remain positive on PSNS axis and at the most decrease by one point when going from a supine to an upright position. The SNS tone should remain on the positive SNS axis and increase by only one. If SNS tone increases by more than one it indicates that the body is experiencing stress and is in a stressful state. If SNS tone decreases on standing, it may mean that the individual suffers from pain with laying, is obese, or feels vulnerable lying down. If the point remains in the same position, there is no SNS reserve and it may be indicative of adrenal fatigue. Abnormal PSNS tone occurs if it decreases upon standing by more than one or if it has a negative value.
ANS Assessment Based on Heart Rate Variability:
Supine/Average Quadrant Correction
Upper and Right Axis = Positive Axis
Lower and Left Axis = Negative Axis
Zone 1: Is seen when both the SNS and PSNS are firing at the same normal rate to match each other.
Zone 2: Is seen in trained athletes who are able to diminish their sympathetic firing while increasing their PSNS tone (firing) to promote relaxation and focus, which allows them to enter “the zone” and function at their best.
Zone 3: Is seen in individuals who are experiencing stress, i.e. mental, physiological, and physical stress, which increases the rate of SNS activity, while decreasing PSNS activity. Increased SNS activity may lead to anxiety, insomnia, and inability to relax. Increased SNS activity may worsen medical illness associated with stress, i.e. hypertension, palpitations, diabetes, attention deficit, anxiety, depression, insomnia, irritability, etc. While decreased PSNS activity may affect gastrointestinal functioning, i.e. digestion, immune function, and neurotransmitter production.
Zone 3 Recommendations:
Revolution.calm to promote calmness, healthy mood, mental focus, and inhibitory neurotransmitters (promote relaxation and calmness), i.e. serotonin & GABA
Melatonin is used to support sleep, relaxation, and healthy melatonin levels.
Giddy’up should be used to support a healthy cardiovascular system during periods of stress. Individuals with a history of certain conditions, which improve with vasodilation (i.e. hypertension, heart disease, migraine headaches or sexual dysfunction) may benefit from L-arginine supplementation, which may improve vasodilatation. Relaxation & deep breathing techniques to promote SNS & PSNS balance.
Zone 4: Is seen in individuals who are very sick. There is very little sympathetic or parasympathetic tone. Decreased SNS activity may result in fatigue, malaise, lethargy, difficulty concentrating, and weight gain. Epinephrine and norepinephrine production may be diminished.
Zone 4 Recommendations:
NeuroMax and Revolution Mineral are used to support ANS tone and nerve conductivity.
Phosphorylated Serine is used to support PSNS tone and hypothalamus sensitivity to cortisol.
Use NeuroMax to support adrenal function and epinephrine production by the adrenal gland.
ProbioHealth to support PSNS tone, GI health, and inhibitory neurotransmitter balance.
RevoFood to support GI health, detoxification, and immune function
Relaxation & deep breathing techniques.
Your ANS condition falls within Zone: _____Zone 1 _____Zone 2 _____Zone 3 _____Zone 4
Or
Your ANS sub-zone falls within: _____Zone A _____Zone B _____Zone C _____Zone D _____Zone E
Subcategory Quadrant Correction Graph
Sub-Zones:
A – This is an area of balance or ANS Equilibrium but actually, this is a point of zero SNS and PSNS activity. Follow Zone 4 treatment recommendations.
B – This is an area that represents individuals who are experiencing acute conditions, illness, or toxicity states. Area B represents very high SNS tone and very low PSNS tone. Follow Zone 3 recommendations.
C – This area represents individuals who are very sick with chronic conditions and serious illness. Area C represents very low SNS and PSNS tone. Follow Zone 4 treatment recommendations.
D – This area reflects very low PSNS tone and balanced SNS tone. It may represent very low potassium levels and/or low oxygen levels in the body. Consider checking potassium and oxygen levels. Revolution Essentials, Revolution.calm, ProbioHealth, and PrimeNZyme are recommended.
E – This area reflects very low SNS tone and balanced PSNS tone. It may represent very low calcium and low CO2 / high ammonia levels. Consider checking calcium, CO2, and ammonia levels. NeuroMax, Revolution Essentials, and Detox are recommended.
ANS Condition Abnormalities
High SNS and Low PSNS Activity
Over 3 Point increase in SNS from supine to upright
Usually due to cortisol effect
May be due to hypothyroidism
Recommendations:
Lower cortisol levels & support adrenal function. Phosphorylated Serine to diminish the effects of cortisol on the hypothalamus and support adrenal function. Bio C 1:1 to diminish the effects of unhealthy cortisol levels.
Improve PSNS activity with ProbioHealth, PrimeNZyme, and
Meditation, Yoga, or Heartmath Coherence (biofeedback) Training to increase PSNS activity.
Support thyroid function with Thyroid Support. Consider thyroid profile testing.
Low PSNS Activity
If the PSNS drops more than 3 points. It may suggest the presence of digestive problems.
Recommendations:
Support GI functioning with ProbioHealth, PrimeNZyme, and GI Max especially when the SNS increases as well.
Support PSNS tone with Revolution.calm
Support Liver & GI detoxification. The more the SNS goes up, the greater the need to look for toxicity and inflammation. Consider OptiCleans GHI or MedCaps DPO to aid with detoxification.
Increased PSNS and Decrease SNS Activity
If the PSNS increases but the SNS decreases (or stays the same) it may be due to obesity, emotional distress, or physical pain while supine.
Recommendations:
Weight management
Address source of physical pain
Revolution.calm to promote relaxation
Deep breathing and relaxation techniques.
No change in PSNS and SNS activity
It may represent poor adrenal gland reserve.
Recommendations:
Check BIA & phase angle
Support adrenals with Adrenal Support
Support PSNS and GI Function with ProbioHealth, PrimeNZyme, & GI Max
Support SNS with NeuroMax
Decreased PSNS and SNS Activity
It may represent adrenal exhaustion
Recommendations:
Check BIA & Phase Angle
Support adrenals with Adrenal Support
Support PSNS and GI function with ProbioHealth, GI max, and PrimeNZyme
Support SNS function with NeuroMax
Spectral Analysis of Heart Rate Variability:
Electrocardiographic Rhythm Strip
Interpretation of ANS Assessment based on Heart Rate Variability
Spectral Summary:
Total Power (TP) reflects the power of one’s autonomic nervous system. It indicates how much power one’s body has to respond to stress, i.e. SNS Function and to relax and digest such as PSNS function and neurotransmitter production. The higher the TP, the better the SNS and PSNS function. If TP is low, less than 1000 supine or standing, it reflects that the SNS and PSNS are not functioning at their best. It may manifest as fatigue, insomnia, poor concentration, anxiety, depression, and poor digestion.
High Frequency (HF) reflects PSNS function
Low Frequency (LF) reflects SNS activity and adrenal cortisol output
LF1 reflects epinephrine and norepinephrine production
LF2 reflects cortisol output
When lying down HF should be higher than LF1 & LF2
Upright
LF1 or HF should be the highest number, which means that there is a quick burst of epinephrine and norepinephrine or PSNS activity (HF). LF2, which represents cortisol output, should not be the highest number. If this occurs, it may mean that there is excessive production of cortisol by the adrenal gland.
If LF2 is the highest number, the body is responding to short-term stressors with a long-term stress hormone, cortisol. It represents that epinephrine and norepinephrine levels are diminished therefore; the body has to use cortisol to adapt to stress. TP should be over 1000. Someone at age 21 will have a TP of 4000-7000, while older individuals are considered to have optimal TP if it is greater than 1000.
Your Total Power: _____greater than 1000 (normal for adults) _____4000-7000 (young adults) _____Below 1000
ECG Patterns:
Normal: Grass like lines with a sharp dip when standing that quickly returns to the same supine patterns within seconds.
Cortisol dominance: Flat non-grassy like pattern in both the supine and standing position with no drop. This pattern is usually seen in adrenal fatigue. There is no adaptability, which reflects decreased SNS function, or reserve.
If Total Power (TP) is les than 1000, amino acids and minerals are needed. Amino acids are the building blocks of neurotransmitters. Minerals are necessary for electrolyte balance.
Recommendations:
NeuroMax provides the amino acids, which are the precursors for neurotransmitters that are needed to increase power.
Revolution Mineral provides the minerals needed for nerve conductivity.
Power Distribution:
Supine:
The supine HF power should be higher than the LF’s with LF1 next and LF2 lowest. This represents that the PSNS (HF) activity is dominant over epinephrine and norepinephrine (LF1) and cortisol (LF2) production.
Upright:
When upright, LF1 should be the highest number, HF should be next, and LF2 should be last indicating that the SNS (LF1) activity is dominant over PSNS (HF) and LF2 (cortisol) activity.
Supine:
Your HP: ___________ Normal _____________ Below Normal ______________ Elevated
Your LF1: __________ Normal _____________ Below Normal ______________ Elevated
Your LF2: __________ Normal _____________ Below Normal ______________ Elevated
Upright:
Your HP: ___________ Normal _____________ Below Normal ______________ Elevated
Your LF1: __________ Normal _____________ Below Normal ______________ Elevated
Your LF2: __________ Normal _____________ Below Normal ______________ Elevated
If HF is low supine and LF2 is higher than LF1 supine, consider elevated cortisol levels.
Recommendations:
Revolution.calm, Phosphorylated Serine, and Vitamin C to lower LF2 (cortisol)
ProbioHealth to increase HF (PSNS function)
NeuroMax to improve LF1 (SNS function) and HF (PSNS function)
If both LF1 and LF2 are low:
NeuroMax to increase LF1 (PSNS function)
Adrenal Support to increase LF2 (SNS function)
If just LF1 is low:
Labs: check Thyroid
Recommendations:
Thyroid Support to support thyroid gland function
Adrenal support to support adrenal function and energy levels.
Body composition is an indicator of health. The research and evidence is clear: excess body fat is related to decreased health. Progress in reducing body fat can be challenging and frustrating, especially when you are gaining muscle at the same time as losing fat. Stepping on the scale results in frustration as it appears you aren’t making the progress you should be making.
Accurate assessment of body composition should be an essential component of any health and weight loss program. The problem is that you simply can’t rely on the most common methods to assess body composition and body fat.
Body fat is THE measurement you need
There are several ways to determine your body fat percent. A few of the most feasible approaches are listed below.
Metropolitan Life Insurance Height-Weight Tables were originally developed to establish recommended weight ranges for men and women. The “desirable” weights were those associated with the lowest death rates among large population studies of insured people. Unfortunately, these studies do not accurately represent a cross-section of the current American population.
WaistMeasurement is an additional, independent risk factor and can be used in conjunction with any other method. It reflects growing evidence that excess visceral fat – surrounding the abdominal organs – on its own increases the chance of heart disease or diabetes.
Research indicates that visceral fat (waist size) is more important in the disease process than subcutaneous fat which is just under the skin (“love handles,” “pinchable inches”). Abdominal fat cells appear to produce certain compounds that promote inflammation and may influence cholesterol and glucose metabolism. In men, a waist size of >40″ and in women >35″ is an indication of increased health risk.
Underwater Weighing when done accurately is considered one of the best ways of determining body fat composition. However, it is impractical and not always done with the precision necessary to achieve useful results. More often, in research, underwater weighing is used as the reference standard to confirm the accuracy of the technique in question.
DEXA Scan Body Composition is considered the Gold-Standard for body composition by most physicians. This was the test used on NBC’s hit show ‘The Biggest Loser’. However, this test can only be performed in a facility that has a DEXA scanner. The logistics of getting this test performed make it difficult to perform routinely so it is difficulty to track progress on an ongoing basis.
BIA Test for Body Composition
Bioelectrical Impedance is measured when a very small electrical signal carried by water and fluids is passed through the body. Impedance is greatest in fat tissue, which contains only 10-20% water, while fat-free mass, which contains 70-75% water, allows the signal to pass much more easily. By using the impedance measurements along with a person’s height and weight, and body type (gender, age, fitness level), it is possible to calculate the percentage of body fat, fat-free mass, hydration level, and other body composition values.
Using BIA to estimate person’s body fat assumes that the body is within normal hydration ranges. When a person is dehydrated, the amount of fat tissue can be overestimated. Factors that can affect hydration include not drinking enough fluids, drinking too much caffeine or alcohol, exercising or eating just before measuring, certain prescription drugs or diuretics, illness, or a woman’s menstrual cycle. Measuring under consistent conditions (proper hydration and same time of day) will yield best results with this method.
We measure body composition in the clinic using the Quantum unit from RJL Systems, the pioneer of bioelectrical impedance analysis (BIA) and related sciences since 1979. Since that time RJL has delivered more than 12,000 instruments to customers throughout the world. In addition, more than 1,000 abstracts and peer review articles have been written about BIA using RJL Systems instruments. RJL instruments sets the standard for body composition.
The RJL Systems Quantumseries assesses three compartments of your body (fat, fat-free cells and tissue, and water) and composition with accuracy and repeatability, which is a significant step beyond all other analyzers. Most equipment only reports body composition in two compartments: fat and fat-free mass.
RJL instruments and software assess body composition, or in other words, the different structures or parts of your body. The BIA can measure and track changes in the amounts of body fluids, fat, and lean body mass, which includes your muscles and organs. The BIA distinguishes where the water is located in your body – either intracellular or extracellular. Functionally the BIA assesses how much of your body is acting as functioning cells (called the body cell mass or “BCM” on the report), transport tissue (extracellular mass or “ECM” on the report) or storage cells (fat).
Functional Mass is where metabolic work is done and calories are burned.
Transport Mass is tissue that transports nutrients and oxygen to cells and removes waste products. It has also been called mesenchyme, the tissue matrix, etc.
Storage Mass is the fat where energy is stored.
Preparing for the Test:
If you haven’t had a BIA done before, it is important to be prepared. The Quantum BIA sends a very minute electrical current throughout your body. Although, the electrical current is so small that it is undetectable, if you have a pacemaker or automatic implantable cardiac defibrillator (AICD), you should not have a BIA done with an RJL Quantum unit.
All metal jewelry should be removed. Although you won’t feel anything, metal removal improves accuracy.
Avoid exercise or other activity that would make you sweat at least 8 hours before your test. This is important to get accurate body fluid results.
Avoid caffeine or alcohol in large quantities 12 hours before the test.
Go to the bathroom before the test to get rid of any waste products. If you have diarrhea, it is important to tell the staff, as diarrhea can affect your body fluid results.
Your height and weight will be measured. Your height will only be taken the first time, but your weight will be measured each time you come in for a BIA. Since an accurate weight is important, remember to empty out your pockets, remove your shoes and any other heavy clothing.
You will be asked to remove your right shoe and sock and lie down on a table.
Two electrodes will be placed on your right hand and two more on your right foot. If you have a lot of hair in these areas, you may feel some discomfort when the pads are removed.
Once the leads are hooked up to the electrodes, the test only takes a few seconds.
The BIA data will be input a computer and the results printed for review.
Understanding the BIA Results
There are several measurements of importance that are reported in the BIA results.
Phase Angle: is a measurement of your body’s overall health. Phase angle is based on total body resistance and reactance and is independent of height, weight and body fat. Lower phase angles appear to be consistent with either cell death or a breakdown of the cell membrane. Higher phase angles appear to be consistent large quantities of intact cell membranes and body cell mass. As you would expect the phase angle is increased with an increase in body mass, even though obesity itself is not associated with good health. All living substances have a phase angle. In fresh uncooked vegetables the phase angle can exceed 45 degrees. In cooked vegetables phase angle is zero because they are dead.
Phase Angle is a predictor of outcome and indicates the course of disease or increases as the result of optimal health based on good nutrition and consistent exercise. Desired Phase Angle results:
Men: 6 or greater
Women: 5 or greater
As we get older our phase angle will decrease and will be approximately 4 or less when we die. Fit adolescents may have a phase angle greater than 10. This effect is a result of cell integrity due to age.
Body Mass Index (BMI): is a ratio between weight and height. It is a mathematical formula that correlates somewhat with body fat. If your BMI is high, you may have an increased risk of developing certain diseases, including:
Adult-Onset Diabetes (Type II – insulin resistance)
Sleep Apnea
Osteoarthritis
Female Infertility
BMI is a better predictor of disease risk than body weight alone. However, there are certain people who should not use BMI as the basis for estimating body fat content: competitive athletes and body builders, whose BMI is high due to a relatively larger amount of muscle, and women who are pregnant or lactating. Nor is it intended for use in growing children or in frail and sedentary elderly individuals. People with BMI between 19-22 have been shown to live the longest.
Fat: this is reported both as a percentage of your total weight and your actual body weight in pounds that is fat. Normal values are based on age and gender. Just as you don’t want too much fat, you also want to avoid too little. Having too little fat can cause your body to stop producing important hormones. For men, this means testosterone.
Body Cell Mass (BCM): this is also reported as a percentage of your total weight and as the actual pounds that make up cells that are active like your muscles and organs. The body cell mass are the cells that create your metabolism and energy. They are what keep you healthy. When the body cell mass goes up, you are usually putting on muscle weight. But, when it goes down, you are losing muscle mass.
ECM: stands for extracellular mass. This number is the amount of your body weight in pounds that is made up of your skeleton and other support structures, as well as ECW. It is composed of tissue that is between cells. When this number changes, it is showing that there was a change in the ECW. This number does not show changes in bone density.
FFM: describes the combination of all cells and tissues that are not fat, in other words, the Fat Free Mass.
Impedance Index: is another measurement of your general health. Normal values for both men and women are greater than 1273. If your impedance index is more than 1273, you are at a better level of health and fitness than if it is below 1273.
Parallel capacitance: All living things are made of cells. Cells are membrane bounded compartments filled with a concentrated solution of chemicals and salts. Groups of cells perform specialized functions and are linked by an intricate communications system. The cell membrane maintains an ion concentration gradient between the intracellular and extracellular spaces. This gradient creates an electrical potential difference across the membrane which is essential to cell survival. Electrical gradients are necessary to support movement of oxygen, carbon dioxide, and nutrients. Therefore, the cell membrane has electrically insulating qualities or capacitance.
Electrical capacitance will increase or decrease depending on the health and the number of cells. Damage to the cell membrane, and its functions, is as lethal to the cell as direct damage to the nucleus itself.
The cell membrane functions as a permeable barrier separating the intracellular (cytoplasm) and extracellular components. The lipid membrane is transversed by proteins, which are soluble in water thus making pores through which water, ions and other chemicals can enter and exit the cell.
Parallel capacitance is somewhat like phase angle, whereas it is not affected by weight or body fat. It is a measure of cell membrane health in all living substances and can change dramatically depending on disease or good health. A body builder, for example, would have a high parallel capacitance and low resistance, or more cell volume, because he is extremely muscular and fit. A malnourished AIDS patient would have a low parallel capacitance.
Basal Metabolic Rate (BMR) is how many calories are burned at rest during the average day. The metabolic rate is determined by how many cells are producing oxidative energy. The more cells, the more energy, and the higher the basal metabolic rate. Thyroid, other hormones, medications, etc. all can affect the basal metabolic rate. A low basal metabolic rate means that any calories you consume above your unique basal metabolic rate are unnecessary to supporting you and will be converted into storage (fat). A low body temperature would occur if your rate of calorie burn is too low. If you consume a lot more calories than you need, then you may have an excessive appetite problem, which can be due to a neurotransmitter imbalance.
Metabolism occurs in two distinct and interdependent phases: 1.) catabolism, in which the body breaks down food into its component parts and harvests the energy stored in its atomic bonds, and 2.) anabolism, in which those component parts and energy are used to build new tissues and conduct basic life functions. Basal Metabolic Rate (BMR) is the amount of energy your body requires every day to perform its most basic function including:
Breathing
Digesting
Heart beating
Muscle activity
Transportation of fluids and tissue
Circulation of blood
This is the amount of energy you would require if you laid in bed all day without ever moving a single muscle. Since most of us do a bit more than that, a daily activity level must also be factored in. This ranges from everyday activities to working out strenuously. BMR varies between the sexes. Lean body mass is a major determinant. Because women tend to have less lean muscle mass, their BMR is lower than that of otherwise comparable males. BMR is at peak during infancy, then declines rapidly through childhood and adolescence. It continues to fall slowly with increasing age and decline further with old age largely due to a loss of muscle mass. However, this is not inevitable, because weight-bearing (resistance) exercise will prevent or reverse muscle loss among the elderly.
Fluid Assessment: is described in the section called Total Body Water Compartments, which tells about the fluid level and distribution in your body. The fluid is actually primarily water. Your total body water (TBW) is measured in liters (L) and is made up of:
Intracellular Water (ICW): the fluid inside all of your body’s cells. The cells of your muscles and organs (liver, kidney, brain, etc) contain more water than fat cells. The closer to ideal your ICW, the greater the number of cells that contribute to your metabolism.
Extracellular Water (ECW) is the fluid that circulates outside your cells and throughout your body. This includes your blood, lymphatic tissue, and the ECM discussed previously. It should be noted that oxygen delivery to the cells is markedly reduced when there is excess extracellular water (edema).
Total Body Water (TBW): If you are dehydrated or losing a lot of fluid, your total body water may be low. If you are retaining fluid or have an infection, your total body water may be elevated compared to ideal.
Water Compartmentalization is among the most valuable features of the BIA since it tells how much water is in the cell and how much is outside of the cell. The water content inside the cell (“intra-cellular water”) is termed the “ICW” and the water content outside of cells (“extra-cellular water’) is termed the “ECW.” The total body water content is called “TBW.” These three values implicate:
The functional integrity of the cell membrane, which is responsible in part for the electro-osmotic gradient across the cell membrane. The content of the intracellular environment must be in balance with the surrounding tissue in order to function properly in terms of cell nutrition and detoxification.
The electrolyte content inside the cell. In order to hold the water inside the cell, electrolytes must be in sufficient quantity to provide the osmotic pressure for water to stay inside the cell. Potassium is one of the major intra-cellular electrolytes whereas sodium is one of the major extra-cellular electrolytes.
The fatty acid content of the cell membrane. If we did not have a lipid layer around every cell in our body, all of the water would leak out. The fat repels the water (like oil and vinegar) and helps keep water within the cell.
The amount of mesenchyme or tissue that has built up with water. Usually this represents toxicity since normally there should be only a modest amount of tissue separating the cells from each other and from blood vessels, nerves, etc. Often times this reflect the amount of ECM discussed above.
References:
M. Ott, H. Fisher, H. Polat, E. B. Helm, M. Frenz, W. F. Caspary B. Lembcke“Bioelectrical Impedance Analysis as a Predictor of Survival in Patient with HIV Infection” J. of Acquired Immune Deficiency Syndromes and Human Retrovirology 9:20-25 1995
R. Liedtke “Principles of Bioelectrical Impedance” http://rjlsystems.com

 This is one post in a series of posts on CIMT Testing and will give you the information you need in order to read your CIMT Test Report.


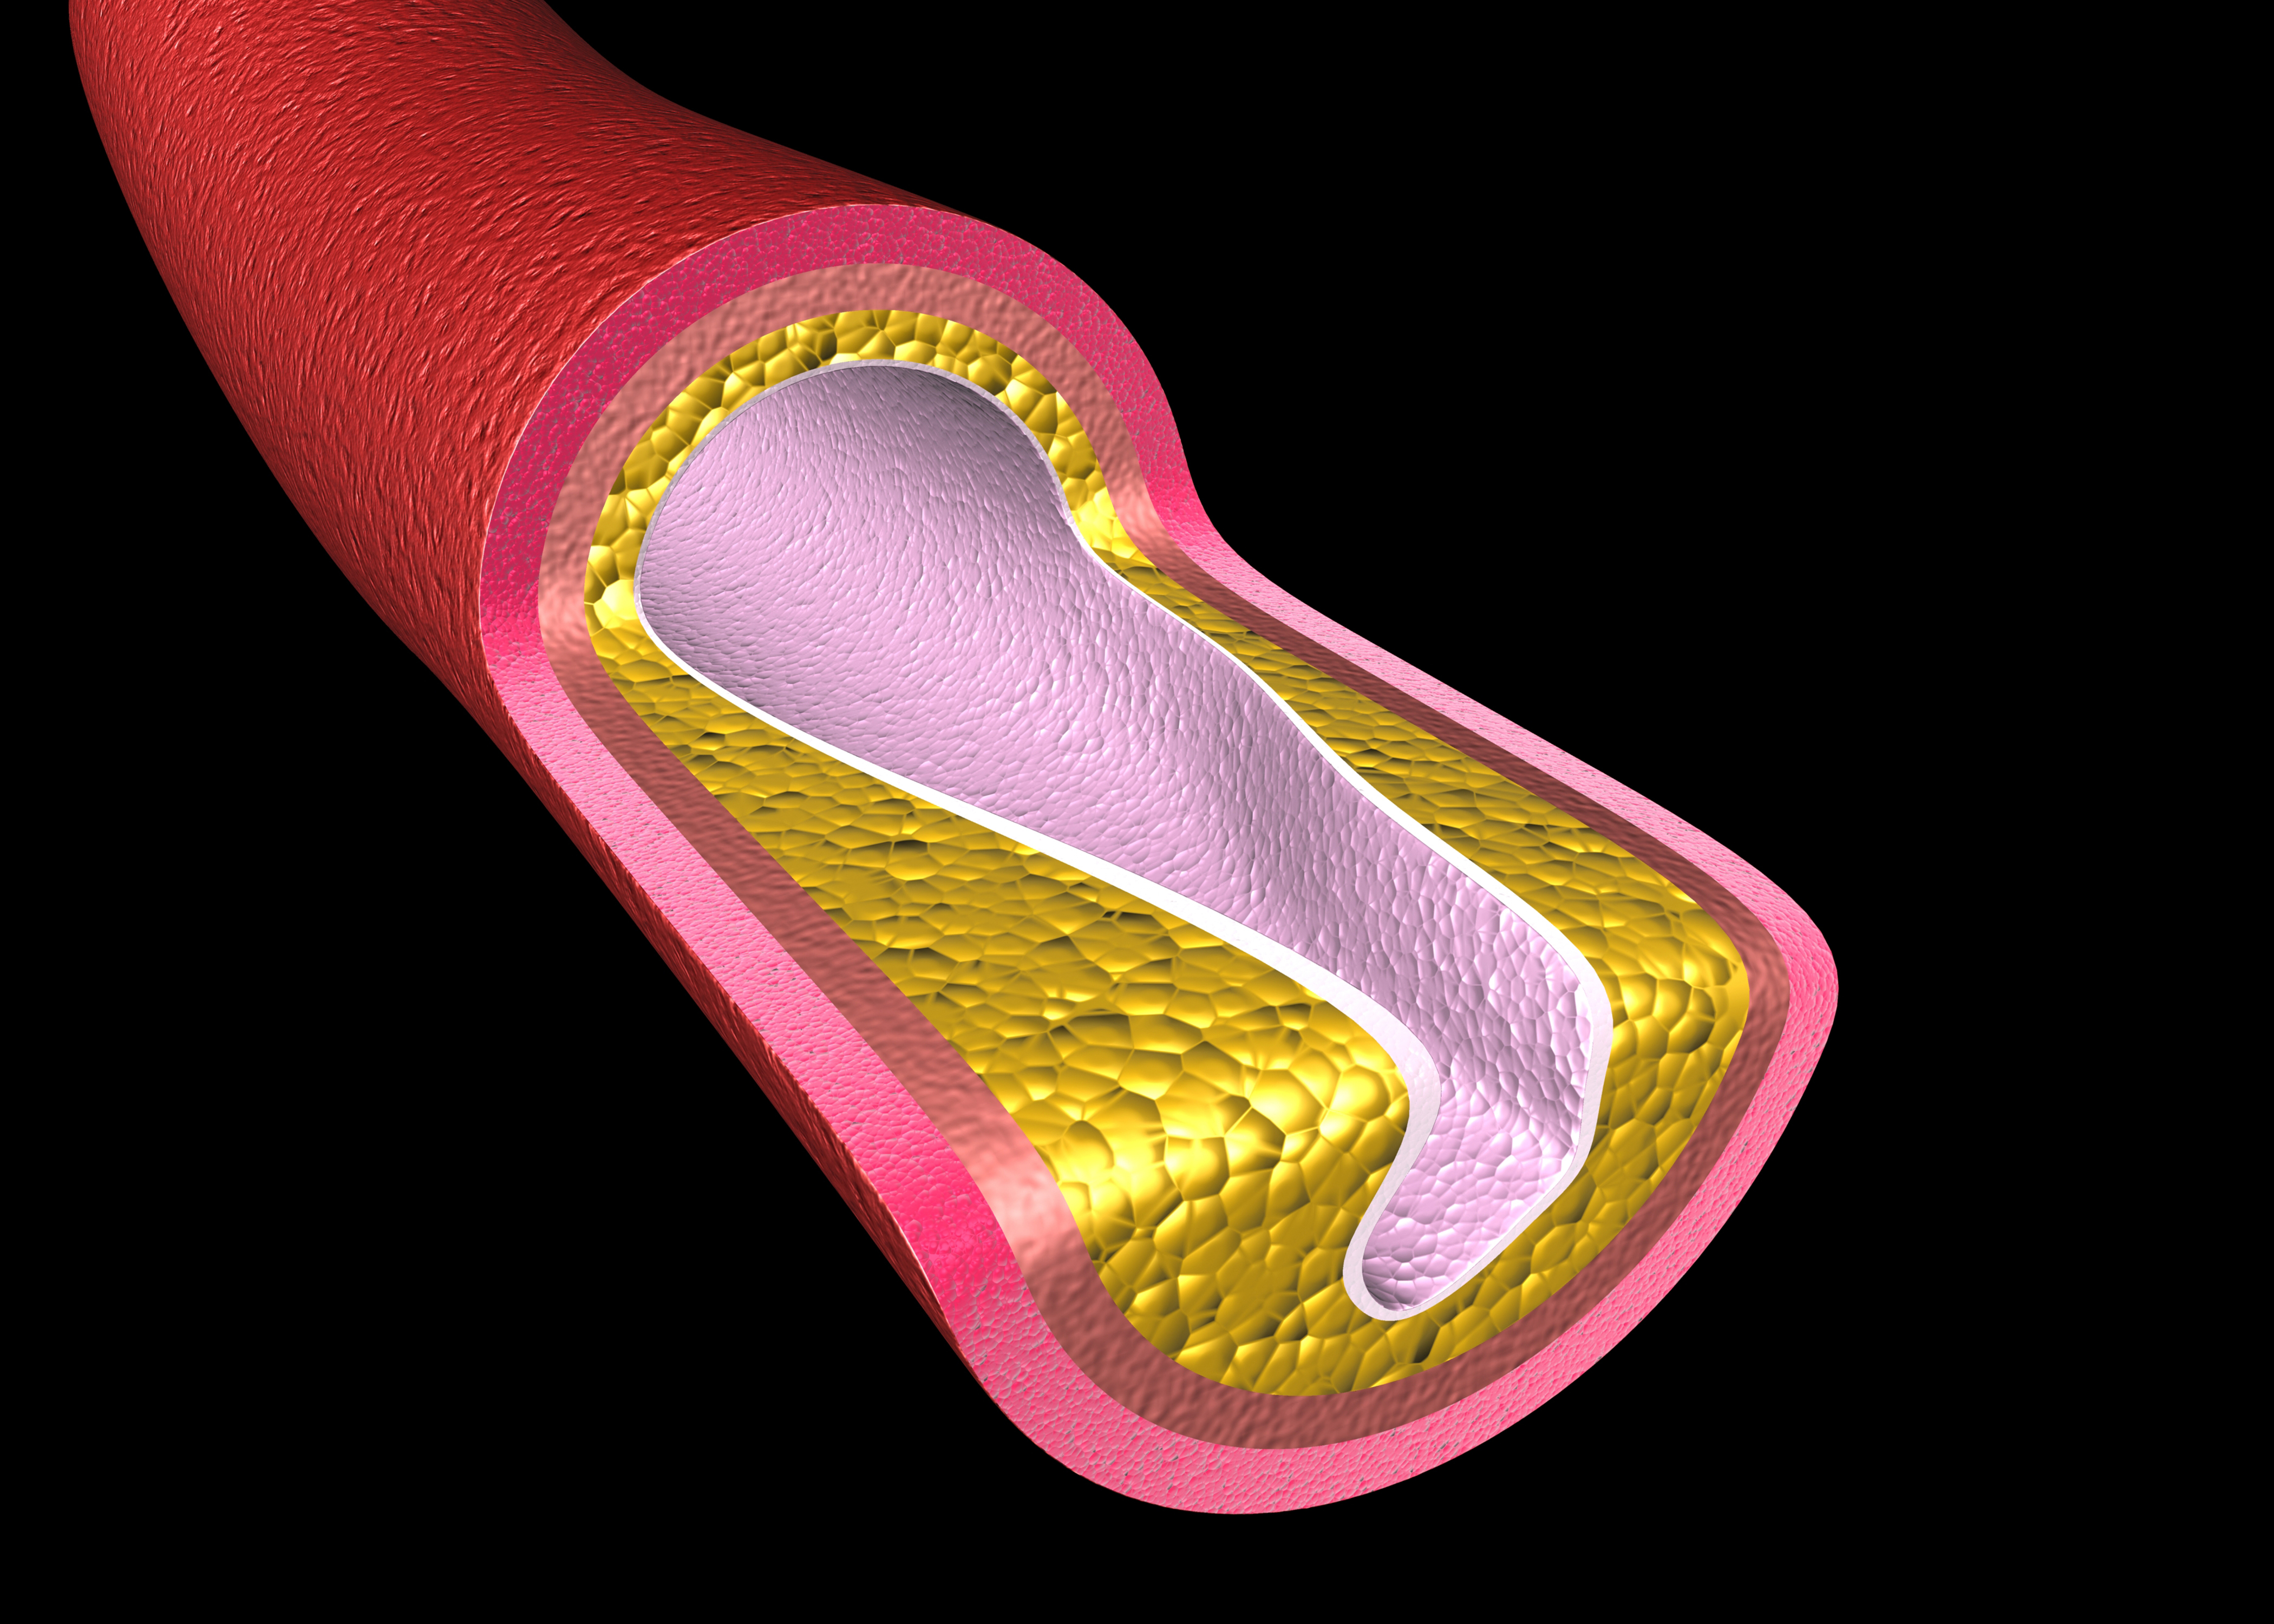


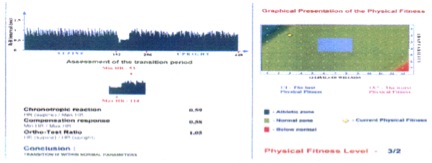
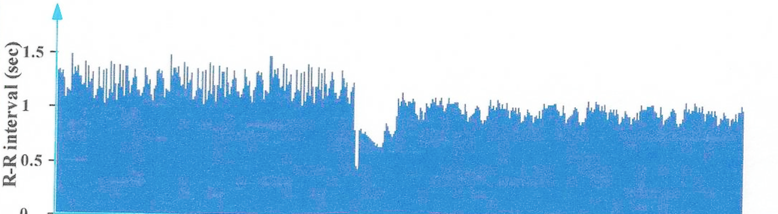
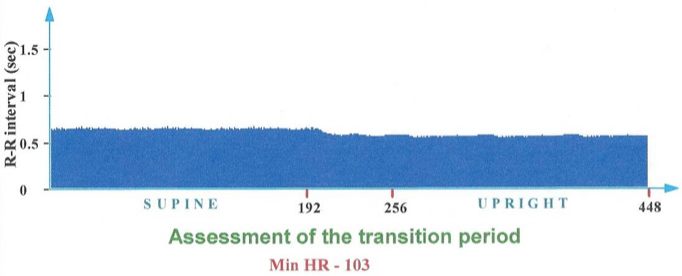

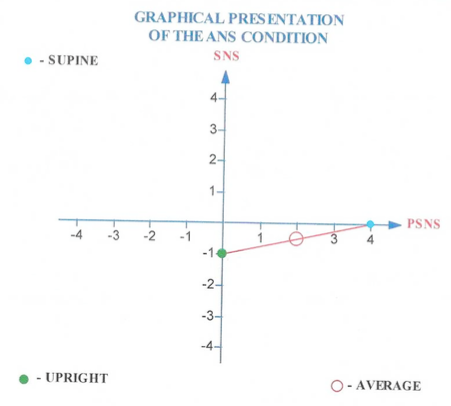
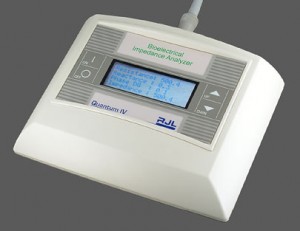 We measure body composition in the clinic using the Quantum unit from RJL Systems, the pioneer of bioelectrical impedance analysis (BIA) and related sciences since 1979. Since that time RJL has delivered more than 12,000 instruments to customers throughout the world. In addition, more than 1,000 abstracts and peer review articles have been written about BIA using RJL Systems instruments. RJL instruments sets the standard for body composition.